On a highway job, a 30-ton excavator shows the same yellow coolant warning for two weeks. An operator notes a “weeping hose” on the daily inspection. The entries sit in separate places. Nobody connects them before the excavator overheats mid-shift while digging a utility trench. Two signals. One missed connection.
Your fleet produces condition data every day. Acting on it gets harder when the data sits in OEM portals, paper inspections and lab reports instead of one construction equipment maintenance software record. Teams use different asset names. The review owner is unclear. A useful signal is easy to miss.
Condition monitoring starts with the records your fleet already keeps. Your team watches for changes, acts on agreed thresholds and records the outcome. This guide covers the signals your fleet produces, a 90-day pilot plan and the history of predictive maintenance needs.

What Is Condition Monitoring?
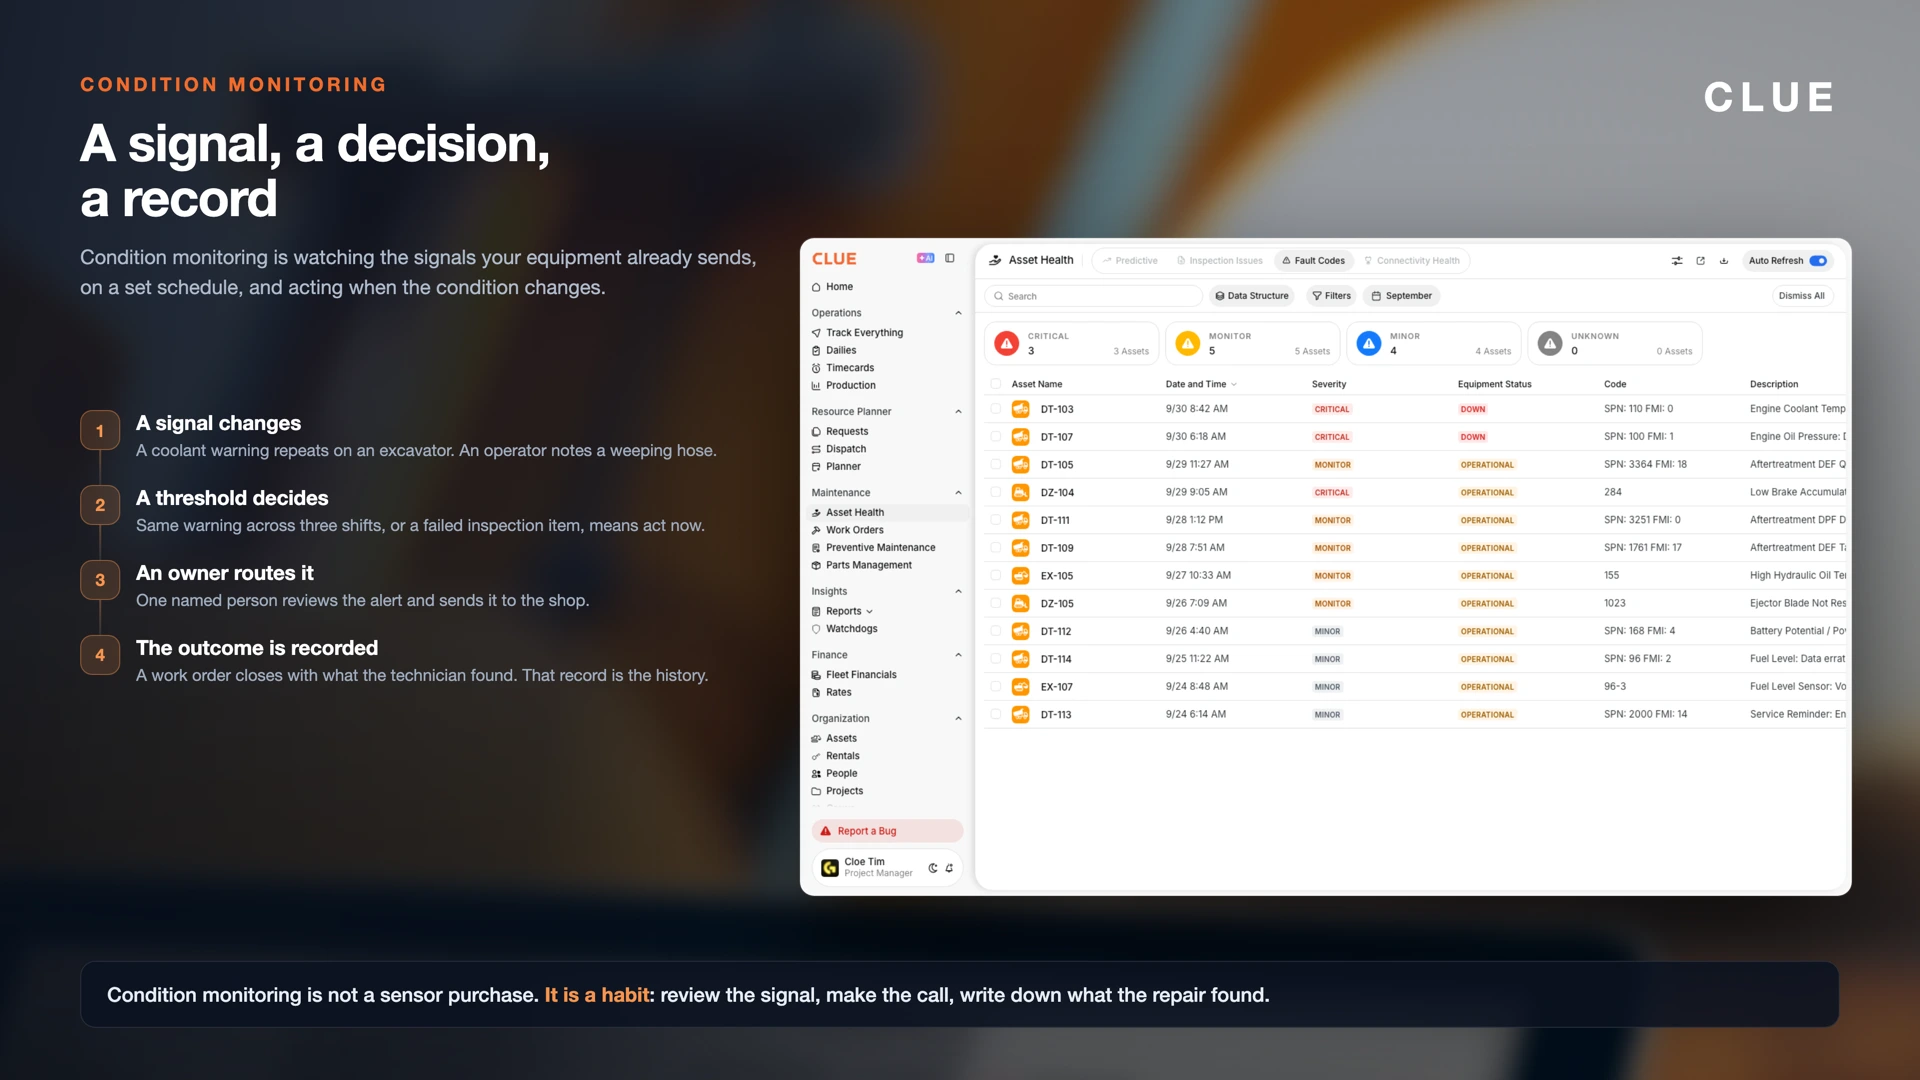
Condition monitoring is the practice of watching equipment signals on a set schedule and acting when the condition changes. The signals include fault codes, meter readings, fluid samples, inspection notes and tire pressure. A condition monitoring program records four things for every signal: what the signal was, who reviewed it, what was decided and what the repair found.
Some teams write it as condition based monitoring. The practice is the same.
Condition monitoring is not a sensor purchase. It is a habit. Your team reviews signals, makes a decision and records what happened.
Three other terms sit next to it. Preventive maintenance triggers work by time or hours, even when condition looks normal. A clear preventive maintenance plan keeps those tasks on schedule. Condition-based maintenance is the strategy of doing work when an observed condition says work is due. Predictive maintenance uses a history of condition changes to estimate a future need.
Condition monitoring supplies the reading. Condition-based maintenance decides what to do about it.
Condition Monitoring vs Predictive Maintenance: The Core Difference
Condition monitoring tells you the state of a machine today. Predictive maintenance estimates the state of that machine next month. Condition monitoring answers “what is happening now.” Predictive maintenance answers “what happens next.” A fleet can start condition monitoring this week with records it already keeps. Predictive maintenance needs those records first.
The practical difference is lead time. Condition monitoring gives you notice once a signal crosses a line. By then the fault is already there. Predictive maintenance aims to give notice before the line is crossed, from the shape of the trend.
Both use the same inputs. A fault code, an oil sample and a failed inspection item feed either one. The difference is what you do with the history behind them. Condition monitoring reads the latest reading. Predictive maintenance reads the pattern.
One more term completes the set. Prescriptive maintenance adds a suggested action to the forecast, such as which of two repair dates costs less.
For a fleet, the order is the point. Condition monitoring produces the record. Predictive maintenance reads that record. Skipping the first step leaves the second with nothing to learn from.
Reactive, Preventive, Condition-Based, Predictive and Prescriptive Maintenance at a Glance
Five maintenance strategies cover most construction fleets: reactive, preventive, condition-based, predictive and prescriptive. Reactive work starts after a failure. Preventive work follows the calendar or the meter. Condition-based work follows a change in condition. Predictive work uses a history of changes to estimate what happens next. Prescriptive work adds a suggested action to that estimate.
Most fleets run two or three of these at once. A haul truck can be on a calendar oil change and a condition-based hose watch in the same week. The table below sets out what triggers each one, when you find out, and what it costs you to get wrong across preventive vs predictive maintenance and preventive vs reactive maintenance.
| Approach | What Triggers Work | When You Find Out | Data Needed | Typical Fleet Example | Main Risk |
|---|---|---|---|---|---|
| Reactive | A failure stops or limits work. | After the failure. There is no notice. | A reported failure and repair details. | Replace a hose after it bursts on a shift. | The repair lands in the middle of a job, at rental rates. |
| Preventive | A date, service interval or engine hour. | Not at all. Work happens on the schedule, whatever the condition. | Calendar, usage and service records. | Change fluids at a planned hour interval. | Work comes before condition calls for it, or a fault arrives between services. |
| Condition-based | A signal crosses an agreed threshold. | When a signal crosses the line. The fault is already there. | Inspections, alerts, samples or readings, plus an agreed threshold. | Replace a hose after a repeated coolant warning and a failed inspection item. | A signal is missed, or it has no owner and nobody acts. |
| Predictive | A trend suggests a future failure. | Before a signal crosses the line, from the shape of the trend. | Consistent condition history tied to repair outcomes. | Schedule a hose change from a rising fault trend on that asset. | Thin or mismatched history produces a confident wrong answer. |
| Prescriptive | An analysis suggests a specific action. | With the forecast, plus a recommended step. | Predictive history plus cost, parts and schedule data. | Rank two repair dates by cost and job impact. | The recommendation is only as good as the inputs behind it. |
Construction equipment management software keeps condition signals and preventive maintenance plans in one place.

Why Condition Monitoring Comes Before Predictive Maintenance
Predictive tools need a record to learn from. Equipment condition monitoring builds that record: condition history linked to repairs, inspections and work outcomes. Three things break it. Asset names that change between systems stop the history joining up. Alerts with no recorded action leave nobody able to say what the signal meant. Repairs with no failure mode leave the pattern invisible.
Your team needs to know whether a signal led to a repair, a follow-up check or no work. That outcome is what shows how each signal behaves on your assets and your jobs.
The U.S. Department of Energy’s Operations & Maintenance Best Practices Guide, Release 3.0 says, “Past studies have estimated that a properly functioning predictive maintenance program can provide a savings of 8% to 12% over a program utilizing preventive maintenance alone.” The guide also reports industrial survey averages for a functional predictive program: maintenance costs down 25% to 30%, breakdowns down 70% to 75%, and downtime down 35% to 45%.
Those are estimates from facility studies, not construction fleets. The guide was published in August 2010. The quote begins “Past studies have estimated.” They show why teams value predictive maintenance. They do not remove the need to build condition records first. ISO 17359:2018, “Condition monitoring and diagnostics of machines — General guidelines,” sets out the general procedures to consider when you set up a condition monitoring program. The first step stays simple: watch a signal, act on it and record the result.
There is a detail in that guide worth a second look. DOE defines predictive maintenance as “basing maintenance need on the actual condition of the machine rather than on some preset schedule.” That is the definition the industry now uses for condition-based maintenance. The 8% to 12% saving is attached to acting on condition, not to running a forecasting model.
For a fleet, that is good news. The return the industry quotes starts at the step you can take this quarter.
Six Terms That Explain the Handoff
Condition monitoring and predictive maintenance share a small vocabulary. Two terms do most of the work.
| Term | What it means | Where it comes from |
|---|---|---|
| P-F curve and P-F interval | The curve plots an asset’s condition as it declines. P is the point a failure first becomes detectable. F is the point the asset stops doing its job. The gap between them is the P-F interval. | An industry convention, not a standard. It comes from Nowlan and Heap’s 1978 reliability-centered maintenance report for the U.S. Department of Defense. |
| Failure mode | The specific way a part fails, such as a hose chafing through or a bearing seizing. Two faults behind the same warning light can have different failure modes. | General reliability vocabulary. |
Four more come up often. Remaining useful life (RUL) is an estimate of how long an asset can keep working before it needs the repair. It is what a predictive model produces. Failure modes and effects analysis (FMEA), set out in IEC 60812:2018, lists how a part can fail and how critical each failure is. Reliability-centered maintenance (RCM) picks a maintenance task for each failure mode based on consequence. SAE JA1011 sets the evaluation criteria for an RCM process. A computerized maintenance management system (CMMS) holds the assets, service plans, work orders, parts and repair history. That is where the outcome of each signal gets recorded.
The P-F curve is the clearest way to see the difference between the two strategies. Condition monitoring catches the fault somewhere on the curve, after it becomes detectable. Predictive maintenance tries to read the slope and name a date before the fault arrives.
It also sets the honest answer on lead time. How much notice you get is not a fixed number. It is the length of the P-F interval, for that part, on that machine, doing that work. A chafing hydraulic hose and a failing final drive have different intervals. The way to learn yours is to record when a signal first changed and when the part failed, then compare the two dates.
6 Condition Signals Your Fleet Already Produces
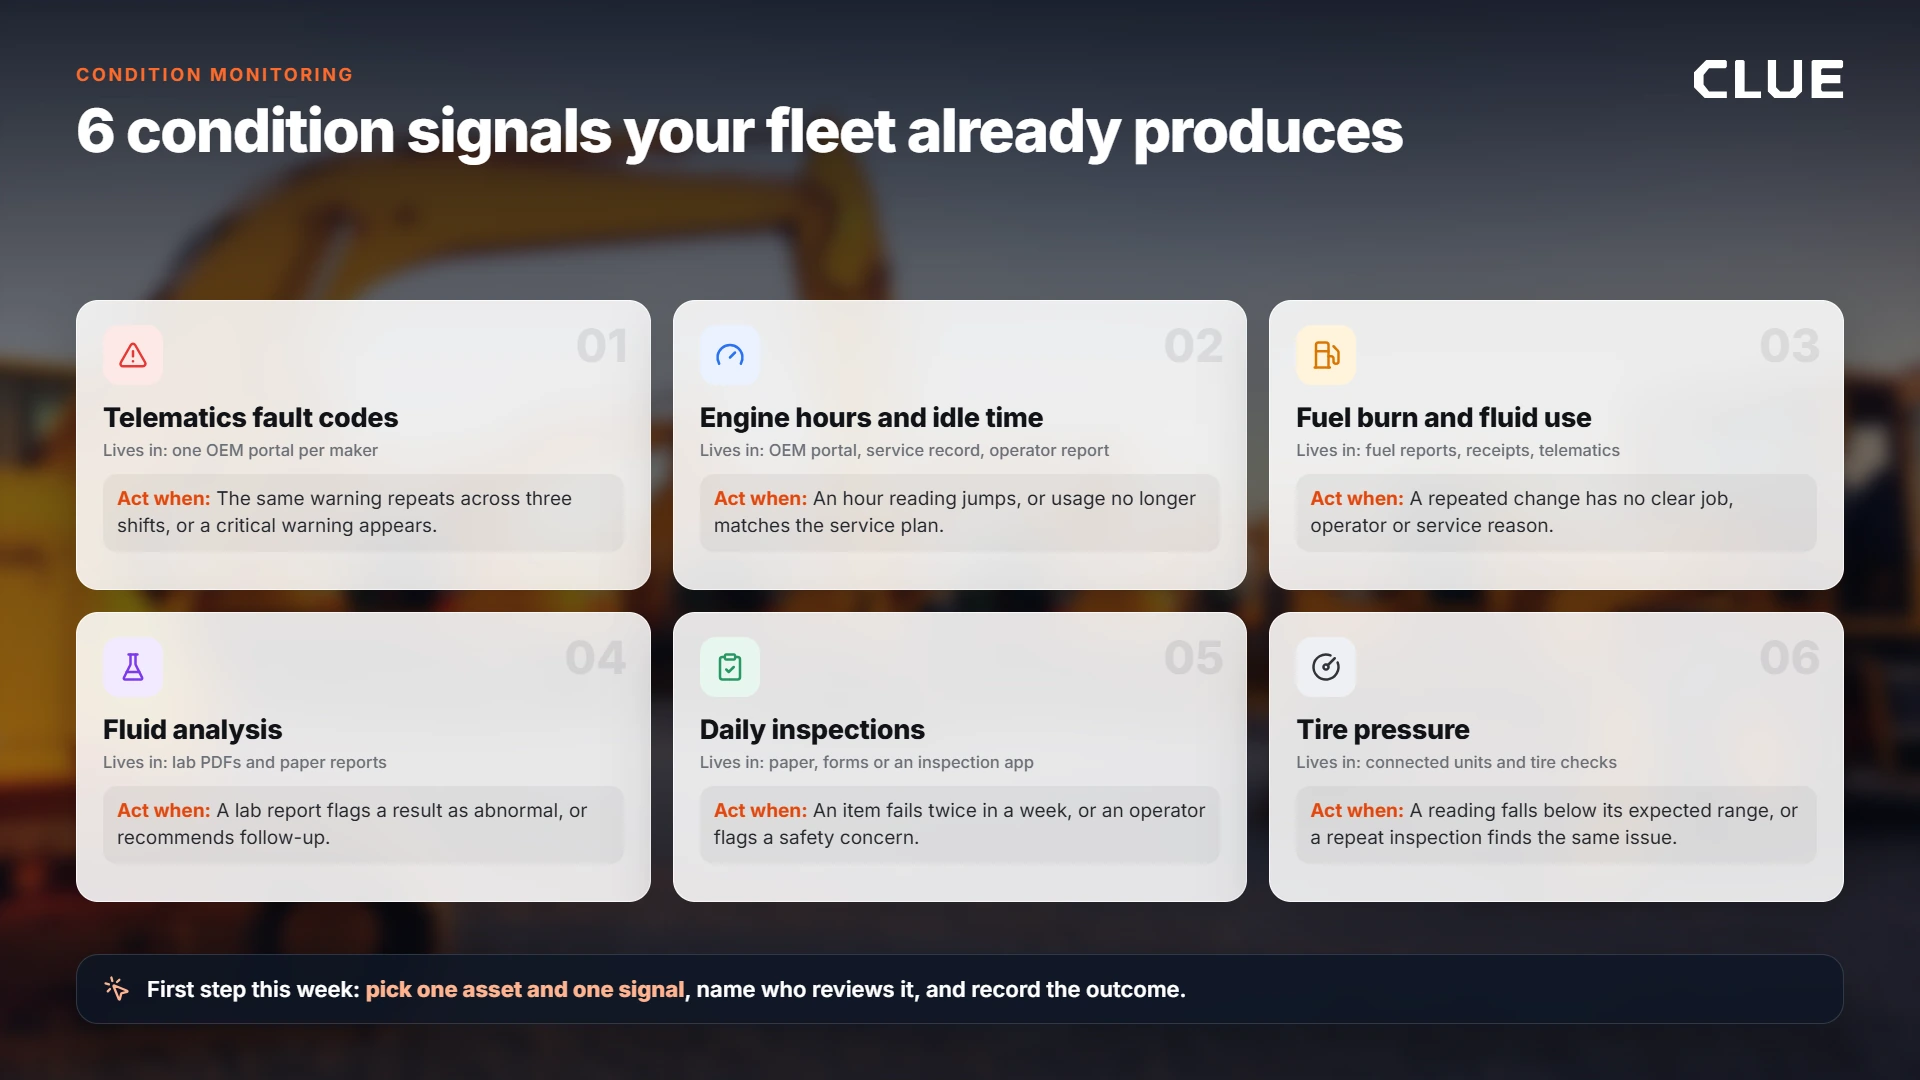
Your equipment shares clues through daily use, service and checks. Start with what your fleet already tracks. Each signal shows what it can tell you, where to find it, when to act, and one step to take this week.
1. Telematics Fault Codes: Catch Repeat Warnings
What it tells you: Fault codes point to an issue in an engine or another monitored system. A repeated warning deserves a closer review.
Where it usually lives today: Codes from heavy equipment telematics sit in separate OEM telematics portals, one per maker.
Two documents sit behind the codes. ISO/TS 15143-3 grew out of the AEMP telematics standard. It gives mixed fleets one data format. SAE J1939 is the recommended practice heavy trucks and equipment use to move data between control units. Its diagnostics part, J1939-73, carries the diagnostic trouble codes. A code is identified by two numbers: a suspect parameter number, which names the failing signal, and a failure mode identifier, which names the type of failure. That pairing is why a mixed fleet’s codes can be read in common.
Act when: The same warning repeats across three shifts, or a critical warning appears.
First step this week: Pick one asset. Record the code, date, operator note and follow-up for your fleet’s top fault code, and agree who reviews each alert.

2. Engine Hours and Idle Time: Put Usage in Context
What it tells you: Engine hours show how much an asset has run. Idle time adds context about when it is running without doing productive work.
Where it usually lives today: Meter readings sit in an OEM portal, a service record or an operator report. A fleet integrating telematics onto one platform reviews those readings side by side.
Act when: An hour reading jumps, or usage no longer matches the service plan.
First step this week: Compare the current meter reading with the last service record. Fix any asset name or reading mismatch before setting a new review habit.
3. Fuel Burn and Fluid Use: Notice Changes in Use
What it tells you: A change in fuel burn or fluid use gives the team a reason to check the asset, its work and its recent service. One reading alone may not explain the cause.
Where it usually lives today: Fuel records sit in reports, receipts or telematics data. Fluid use appears in oiling records or inspection notes.
Act when: A repeated change has no clear job, operator or service reason.
First step this week: Review a recent fuel record beside engine hours and the work performed. Note the reading and context for the next review.
4. Fluid Analysis: Turn a Lab Report Into a Next Step
What it tells you: An oil sample report shows whether a result needs review. It points your team to a follow-up check.
Where it usually lives today: Reports often arrive as PDFs or paper from a lab. They may not be attached to the asset’s service history.
Act when: A lab report flags a result as abnormal, or recommends follow-up.
First step this week: Attach the latest report to the correct asset record. Name the person who will review it and record the next step.
5. Daily Inspections: Bring Field Notes to the Shop
What it tells you: An operator reports a leak, loose part, unusual sound or other visible change before a shift. Repeated notes flag an issue that needs attention.
Where it usually lives today: Notes sit on paper, in a form or in an inspection app. Your pre and post construction equipment inspection checklist captures a consistent record.
Act when: An inspection item fails twice in a week, or an operator flags a safety concern.
First step this week: Pick one repeated inspection issue. Agree how the field team will report it and how the shop will record its response in construction equipment inspection software that keeps every check in one place.
6. Tire Pressure: Find Changes on Connected Trucks
What it tells you: Pressure readings flag underinflation, slow leaks, cross-axle imbalance or pressure that stays low. Tire checks give the team a reason to inspect before a tire issue affects a shift.
Where it usually lives today: Connected trucks report readings. Other tire checks appear on paper or in an inspection.
Act when: A reading falls below its expected range, or a repeat inspection finds the same issue. Follow the equipment maker’s guidance for safe limits.
First step this week: Confirm which trucks report pressure. Review how operators record checks on the rest, and set one consistent construction equipment tire inspection.
Condition Monitoring Techniques, and Where They Fit a Fleet
Five condition monitoring techniques are most often grouped together: vibration analysis, infrared thermography, oil and fluid analysis, ultrasonic testing and electrical signature analysis. Many sources call these the five pillars of condition monitoring. There is no official list. Different sources name different fives. No standard uses the word pillars. ISO 17359:2018 lists seven parameters as examples: vibration, temperature, tribology, flow rate, contamination, power and speed. ISO 18436 certifies people across six disciplines. It has no part for electrical signature analysis, which is the fifth item on that list.
So treat the five as a useful shorthand, not a framework. What matters for your fleet is which of them your assets will give you.
Machine condition monitoring grew up in plants, around motors, pumps, gearboxes and fans that run in one place at a steady speed. A construction fleet is a different problem. The iron moves, the duty cycle changes by the hour, and most of it runs on diesel rather than electric motors. Some of the five transfer well. Some belong to your fixed plant, not your excavators.
| Technique | What it detects | Where it fits best | What it looks like on a construction fleet |
|---|---|---|---|
| Vibration analysis | Imbalance, misalignment, looseness and bearing wear in rotating parts. | Fixed plant that runs at a steady speed. | Crushing and screening plant, shop air compressors and generators. Rare as a route on mobile iron, because the duty cycle changes all day. |
| Infrared thermography | Heat from friction, overload and loose electrical connections. | Anything that gets hot before it fails. | A handheld thermal camera on a wheel end, a brake, a hydraulic pump or a battery terminal during service. |
| Oil and fluid analysis | Wear metals, contamination, water and viscosity change. | Engines, hydraulics, final drives and gearboxes. | The technique most construction fleets already run. The gap is the lab report sitting in a PDF instead of on the asset record. |
| Ultrasonic testing | High-frequency sound from leaks and from parts running without enough grease. | Pressurized systems and greased bearings. | Finding an air or hydraulic leak on a drill or a crane, and checking whether a grease point is taking grease. |
| Electrical signature analysis | Rotor and stator faults read from the current a motor draws. | Electric motors. | Fixed plant and shop equipment. It does not apply to a diesel engine. |
For mobile equipment, two signals do the job a vibration route does in a plant. The fault code stream is one. The daily inspection is the other. A fault code is the machine reporting a change in its own condition. An operator note is a person reporting one. Both are condition monitoring. Both arrive without a sensor purchase.
Start with the techniques your fleet already pays for. Oil analysis and inspections cover most construction assets. Add a thermal camera when the shop has a repeat failure it cannot see. Add vibration or ultrasonic work on fixed plant, where it earns its keep.
The Standards That Cover Condition Monitoring
Six published documents shape how condition monitoring is done and recorded. A fleet does not need to buy them all. Knowing which one covers what helps when a vendor or a lab cites one at you.
| Document | Full title | What it covers |
|---|---|---|
| ISO 17359:2018 | Condition monitoring and diagnostics of machines — General guidelines | The general procedures to consider when setting up a condition monitoring program, and the parameters it gives as examples. The parent document for the rest of the family. |
| ISO 13374 | Condition monitoring and diagnostics of machines — Data processing, communication and presentation | How condition data is processed, passed between systems and presented for a decision. It is a software architecture, not a technique. |
| ISO 18436 | Condition monitoring and diagnostics of machines — Requirements for qualification and assessment of personnel | The training, experience and examination required of the people who do the work. Separate parts cover vibration, field lubricant analysis, lubricant laboratory analysis, acoustic emission, thermography and ultrasound. |
| ISO 20816-1 | Mechanical vibration — Measurement and evaluation of machine vibration — Part 1: General guidelines | How machine vibration is measured and evaluated. |
| ISO/TS 15143-3:2020 | Earth-moving machinery and mobile road construction machinery — Worksite data exchange — Part 3: Telematics data | One data format for mixed fleet telematics, grown out of the AEMP telematics standard. A Technical Specification, and the document that matters most to a construction fleet. |
| SAE J1939 | Serial control and communications heavy-duty vehicle network | A recommended practice for how control units talk on heavy-duty and off-highway machines. Part 73 covers diagnostics, where a fault code is identified by a suspect parameter number paired with a failure mode identifier. |
Two notes worth keeping straight. ISO 18436 certifies people, not equipment, software or programs. No vendor can be “ISO 18436 certified.” No document in this table defines a five-pillar list, which is why the popular one has no source behind it.
Condition Signals and Who Owns Them
Every signal needs a name against it. The table below is the pilot’s operating sheet: one row per signal, one owner, one cadence, one action path and one list of what gets written down. The last two rows cover the checks a technician makes by hand and the assets that report nothing at all.
| Signal | Owner | Review Cadence | Action Path | What to Record |
|---|---|---|---|---|
| Telematics fault codes | Maintenance lead | Each shift or alert | Triage by severity, then review or create work. | Code, asset, date, severity, the decision taken and what the repair found. |
| Engine hours and idle time | Fleet coordinator | Weekly | Compare readings with service records. | Reading, date, source system and any asset name mismatch you corrected. |
| Fuel burn and fluid use | Equipment manager | Weekly | Check for a repeated change and record context. | Reading, engine hours, the job and the operator at the time. |
| Fluid analysis | Shop lead | When a report arrives | Review abnormal results and record follow-up. | Sample date, lab result, the follow-up check and the repair outcome. |
| Daily inspections | Operator and shop lead | Each shift | Route failed items for review or work. | The item that failed, a photo, the date and the shop response. |
| Tire pressure on connected trucks | Fleet or tire lead | Each shift or alert | Inspect and record the result. | Reading, axle and wheel position, date and the action taken. |
| Hands-on checks: heat, sound and feel | Mechanic | At service, and when an operator reports a change | Record what the technician found, then route the work. | What was felt, heard or measured, where on the machine, the date and the part replaced. |
| Assets with no connected data | Shop lead | Weekly | Review operator reports and shop notes as the condition record. | Asset, the reported change, the date and the work that followed. |
What Condition Monitoring Does Well, and Where It Falls Short
Condition monitoring has three clear advantages. It uses data your fleet already collects. It cuts service that condition does not call for. It gives the shop a reason to act before a part fails. Its main limit is timing. Condition monitoring reports a fault that already exists, so the planning window can be short.
Benefits of Condition Monitoring
| Benefit | What it looks like on a fleet |
|---|---|
| It starts with what you have | Fault codes, meter readings, oil reports and inspections are already arriving. The first pilot needs a review habit, not a purchase order. |
| Work follows condition | A hose gets replaced because a warning repeated and an inspection failed, not because a date arrived. |
| Planned beats emergency | A three-hour job at shift end costs less than a four-day rental and a crew standing by. |
| It covers assets with no telematics | An operator note works on a 1998 dozer and on an attachment. A sensor program does not. |
| It builds the record predictive work needs | Every closed alert adds a signal, a decision and an outcome to the history. |
| Thresholds make the call repeatable | When “stop now” is written down, the answer does not change with who is on shift. |
Limits of Condition Monitoring
| Limit | What to do about it |
|---|---|
| The fault already exists | Condition monitoring reports a state, not a forecast. Accept a shorter planning window and set triggers early enough to act on. |
| Thresholds are a judgement call | Set them with the people who run the asset. Review the ones that produced no work after 90 days. |
| Alert volume can bury the signal | Start with a few signals on a few assets. Group codes by severity and agree what each level means. |
| It depends on people doing the review | A signal with no owner is the most common failure. Name a person, not a department. |
| Data sits in several places | Asset names that differ between telematics, inspections and shop records break the history before it starts. |
| It does not rank the work for you | Condition monitoring says something changed. It does not say which of five changes matters most this week. |
Advantages and Disadvantages of Predictive Maintenance
Predictive maintenance earns its place with lead time. It aims to flag a repair before a threshold is crossed, which lets the shop order the part, book the bay and pick a day that does not hurt the job. It also ranks work. When ten assets each show a change in the same week, a trend tells you which one to touch first.
How much lead time it buys depends on the part and the failure mode, not on the software. Anyone quoting one number for every asset is quoting an average from someone else’s plant.
The disadvantages are real and worth saying out loud. Predictive maintenance needs a run of consistent history before it says anything useful, so there is a waiting period with cost and no output. It needs asset IDs that match across systems, which is where most fleets stall. It needs repair outcomes recorded with a failure mode, which is extra work for a technician at the end of a long day. It produces a confident number. A confident number from thin data is worse than no number. It also fits some assets better than others. An asset that runs a handful of hours a year will not generate enough history to model, however good the tool is.
The honest read for a construction fleet is this. Condition monitoring starts returning value as soon as the first alert turns into planned work. Predictive maintenance starts returning value once the records are good enough to trust. Getting the records good enough is the condition monitoring work.
How to Start Condition Monitoring in 90 Days
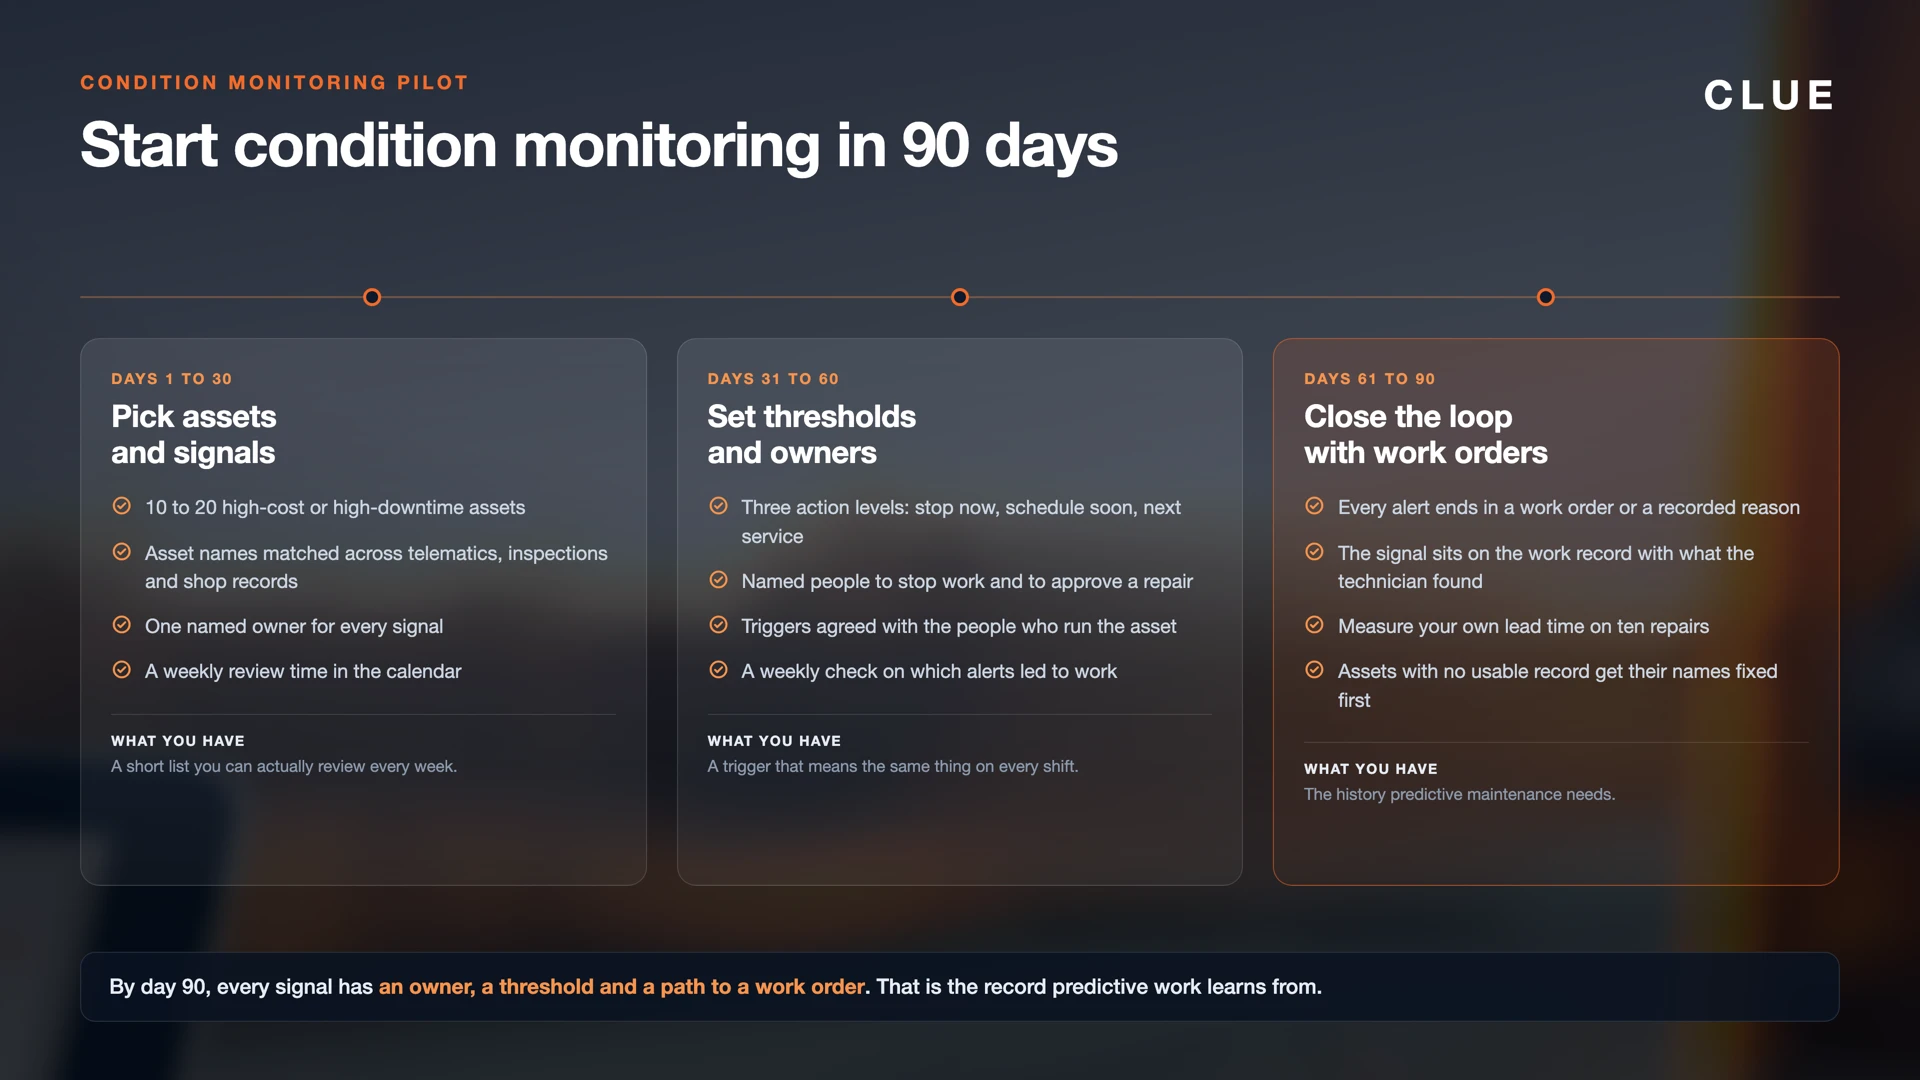
A 90-day plan gives your team time to learn what the data shows. Then it builds a steady process around it. Begin with a small group of assets. By day 90, each signal has an owner and a clear path to a work order.
Days 1 to 30: Pick Assets and Signals
Choose 10 to 20 high-cost or high-downtime assets for the pilot. Include assets that matter to current jobs, such as excavators, loaders, dozers or haul trucks. Check that the asset names match across telematics, inspections and shop records.
Select a few signals your team can review now. Include at least one field signal, such as inspection notes, with a telematics reading or sample report. Choose an owner for each signal. The owner reviews it, routes an issue and records the outcome.
Set a weekly review time. Keep a simple list of the asset, signal, date, owner and next step. Aim for a repeatable record. Keep the analysis simple.
Days 31 to 60: Set Thresholds and Owners
Agree on practical thresholds with the people who know each asset and job. Start with safe, clear triggers. Examples include a repeated warning, an abnormal lab result or a failed inspection item. Set limits for the equipment make in the pilot.
Set three action levels: stop now, schedule soon or next service. Name who stops work and who approves a planned repair. Give each threshold an owner who reviews the alert and routes the work.
Review the pilot list each week. Check which alerts led to work, which need more information and which did not need action. Adjust unclear steps. Keep the reason with each change.
Days 61 to 90: Close the Loop With Work Orders
Close every alert with a work order or a recorded “no action” and a reason. Add the fault code, inspection note, oil result or other signal to the work record. Record what the technician found and what repair followed.
A work order from an inspection or fault code connects a field report to shop action. Review open work weekly. Check that the asset, signal and repair outcome use the same names.
At day 90, review the history and measure your own lead time. For every alert that ended in a repair, write down two dates: the day the signal first changed, and the day the part failed or was replaced. The gap between them is the warning this fleet gets for that failure, on that machine, doing that work. Do it for ten repairs and you have something no industry average can give you.
Then sort the list. Signals with a long gap are worth tighter thresholds, because you have room to plan. Signals with a short gap belong on a stop-now rule. Alerts that repeated without a repair need a threshold review. Assets with no usable record need their names fixed before anything else.
Keep the review cadence. Use the findings in your equipment work order software to decide what to add next.
Worked Example: One Excavator, Two Outcomes
All inputs below are illustrative. Consider a 30-ton excavator on a highway job. The inputs use simple example costs. Replace them with your own rental, repair, labor and production figures.
Path A, no condition monitoring: The coolant warning repeats. An inspection note reports a weeping hose. The records are not connected. The hose fails, the engine overheats and the excavator is down for four days. The contractor rents a replacement.
Illustrative costs:
- Rental replacement: $1,800 per day × 4 days = $7,200
- Emergency parts and outside service: $8,500
- Repair labor: 20 hours × $95 per hour = $1,900
- Lost production: 8 hours while the replacement arrives and the crew changes the plan, at $1,500 per hour = $12,000
- Total illustrative cost: $7,200 + $8,500 + $1,900 + $12,000 = $29,600
The lost production figure covers the initial delay before the replacement is ready. It does not count all four days as lost production.
Path B, condition monitoring: The repeated warning and failed inspection item trigger a work order. The shop replaces the hose in a planned three-hour window at shift end.
Illustrative costs:
- Hose: $450
- Planned labor: 3 hours × $95 per hour = $285
- Lost production: 0 hours because work happens after the shift
- Total illustrative cost: $450 + $285 = $735
The difference between these paths is $28,865 in this example. It reflects the stated inputs, not a forecast for every fleet. Say the failure happens one time in four comparable seasons. The illustrative average avoided cost is then $7,216 per season, on these inputs.
Downtime tracking is what lets a team say what happened and why. A process to reduce equipment downtime starts with seeing the signal, assigning the next step and closing the work record. That record is also the input for everything in the next section.
When Are You Ready for Predictive Maintenance?
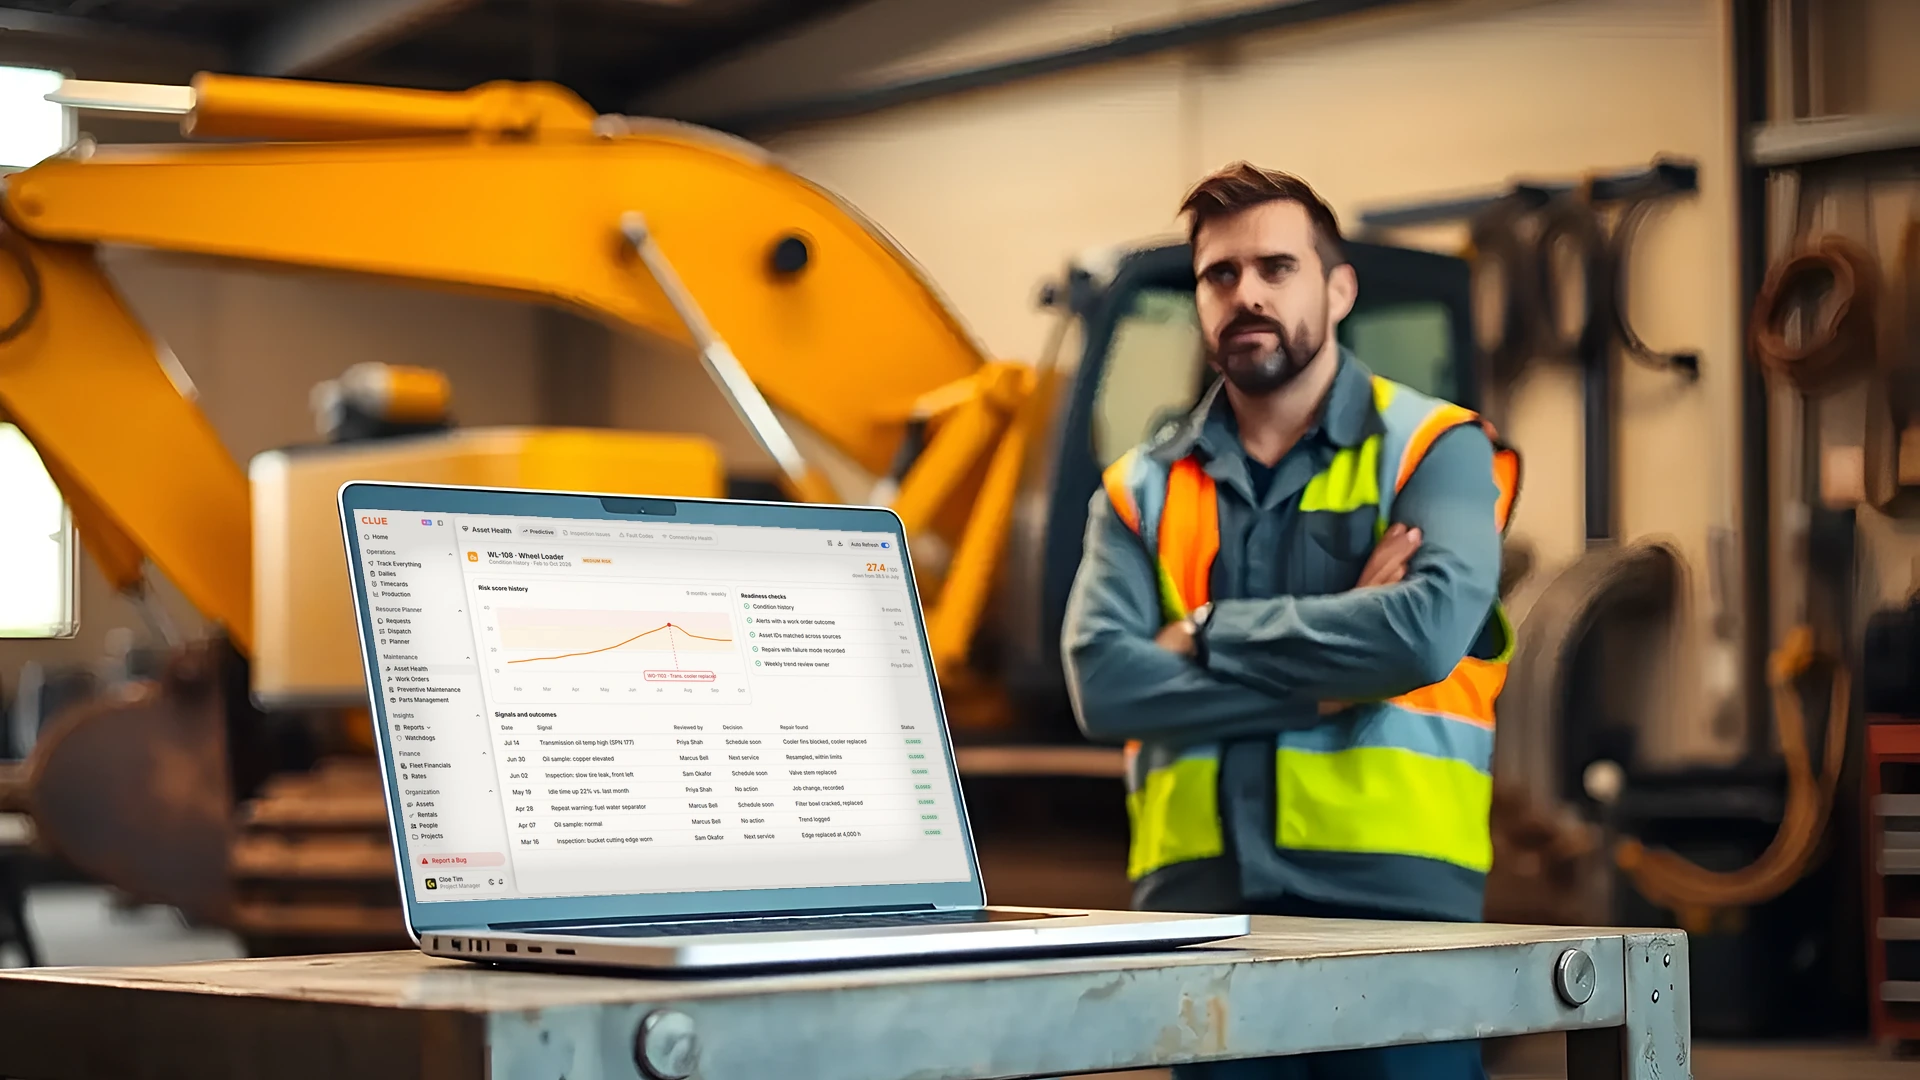
Use these signs to judge readiness for predictive work:
- You have 6 to 12 months of condition history on the pilot assets.
- Every alert has a work order outcome or a recorded reason for no action.
- Asset IDs match across telematics, inspections and shop records.
- Repairs include a failure mode and root cause when known.
- One person reviews trends each week.
- Your team can separate repeat signals from one-time events.
The 6 to 12 month history is a rule of thumb, not a promise. The time depends on three things: how often the asset runs, how often the signal appears and how complete your outcome records are.
If asset names do not match, if alerts have no owner, or if repair outcomes are missing, strengthen those records first. Review predictive maintenance tools once the history is consistent, with the predictive maintenance software buyer’s guide for what to ask a vendor before you commit.
Common Condition Monitoring Mistakes
- Too many alerts with no triage: A long alert list hides the next action. Start with a few signals and agree what each severity means.
- Data in five portals: Separate records make it harder to connect a warning to an inspection or repair. Set a shared asset name and a clear place to record outcomes.
- Thresholds nobody owns: An agreed trigger still needs an owner. Give each signal a person who reviews it and routes the work.
- Ignoring non-telematics assets and attachments: Not every asset reports a code. Inspections and shop notes cover older equipment, attachments and other assets without connected data.
- Buying predictive tools before the basics: A new tool leaves inconsistent asset IDs and missing repair outcomes in place. Build a usable history before you assess breakdown maintenance patterns or predictive options.
How Clue Supports Condition Monitoring
Clue brings telematics from mixed OEM fleets into one place, with fault codes from all makes in one list. Codes are grouped by severity: Critical in red, Warning or Monitor in yellow, and Minor or Informational in blue. Teams filter codes by asset type. They set codes for an asset to auto-ignore when they do not need action. The team reviews fault code severity when it sets its triage steps.
Failed inspection and checklist items become work order tasks, so problems found in the field reach the shop. Oiler reports and fluid inspections capture fluid use as a mini inspection. These records give the team another place to note a change and its follow-up.
For connected trucks, tire pressure monitoring learns each vehicle’s normal pressure over 7 days. It flags underinflation, slow leaks, cross-axle imbalance and chronic low pressure with no extra hardware.
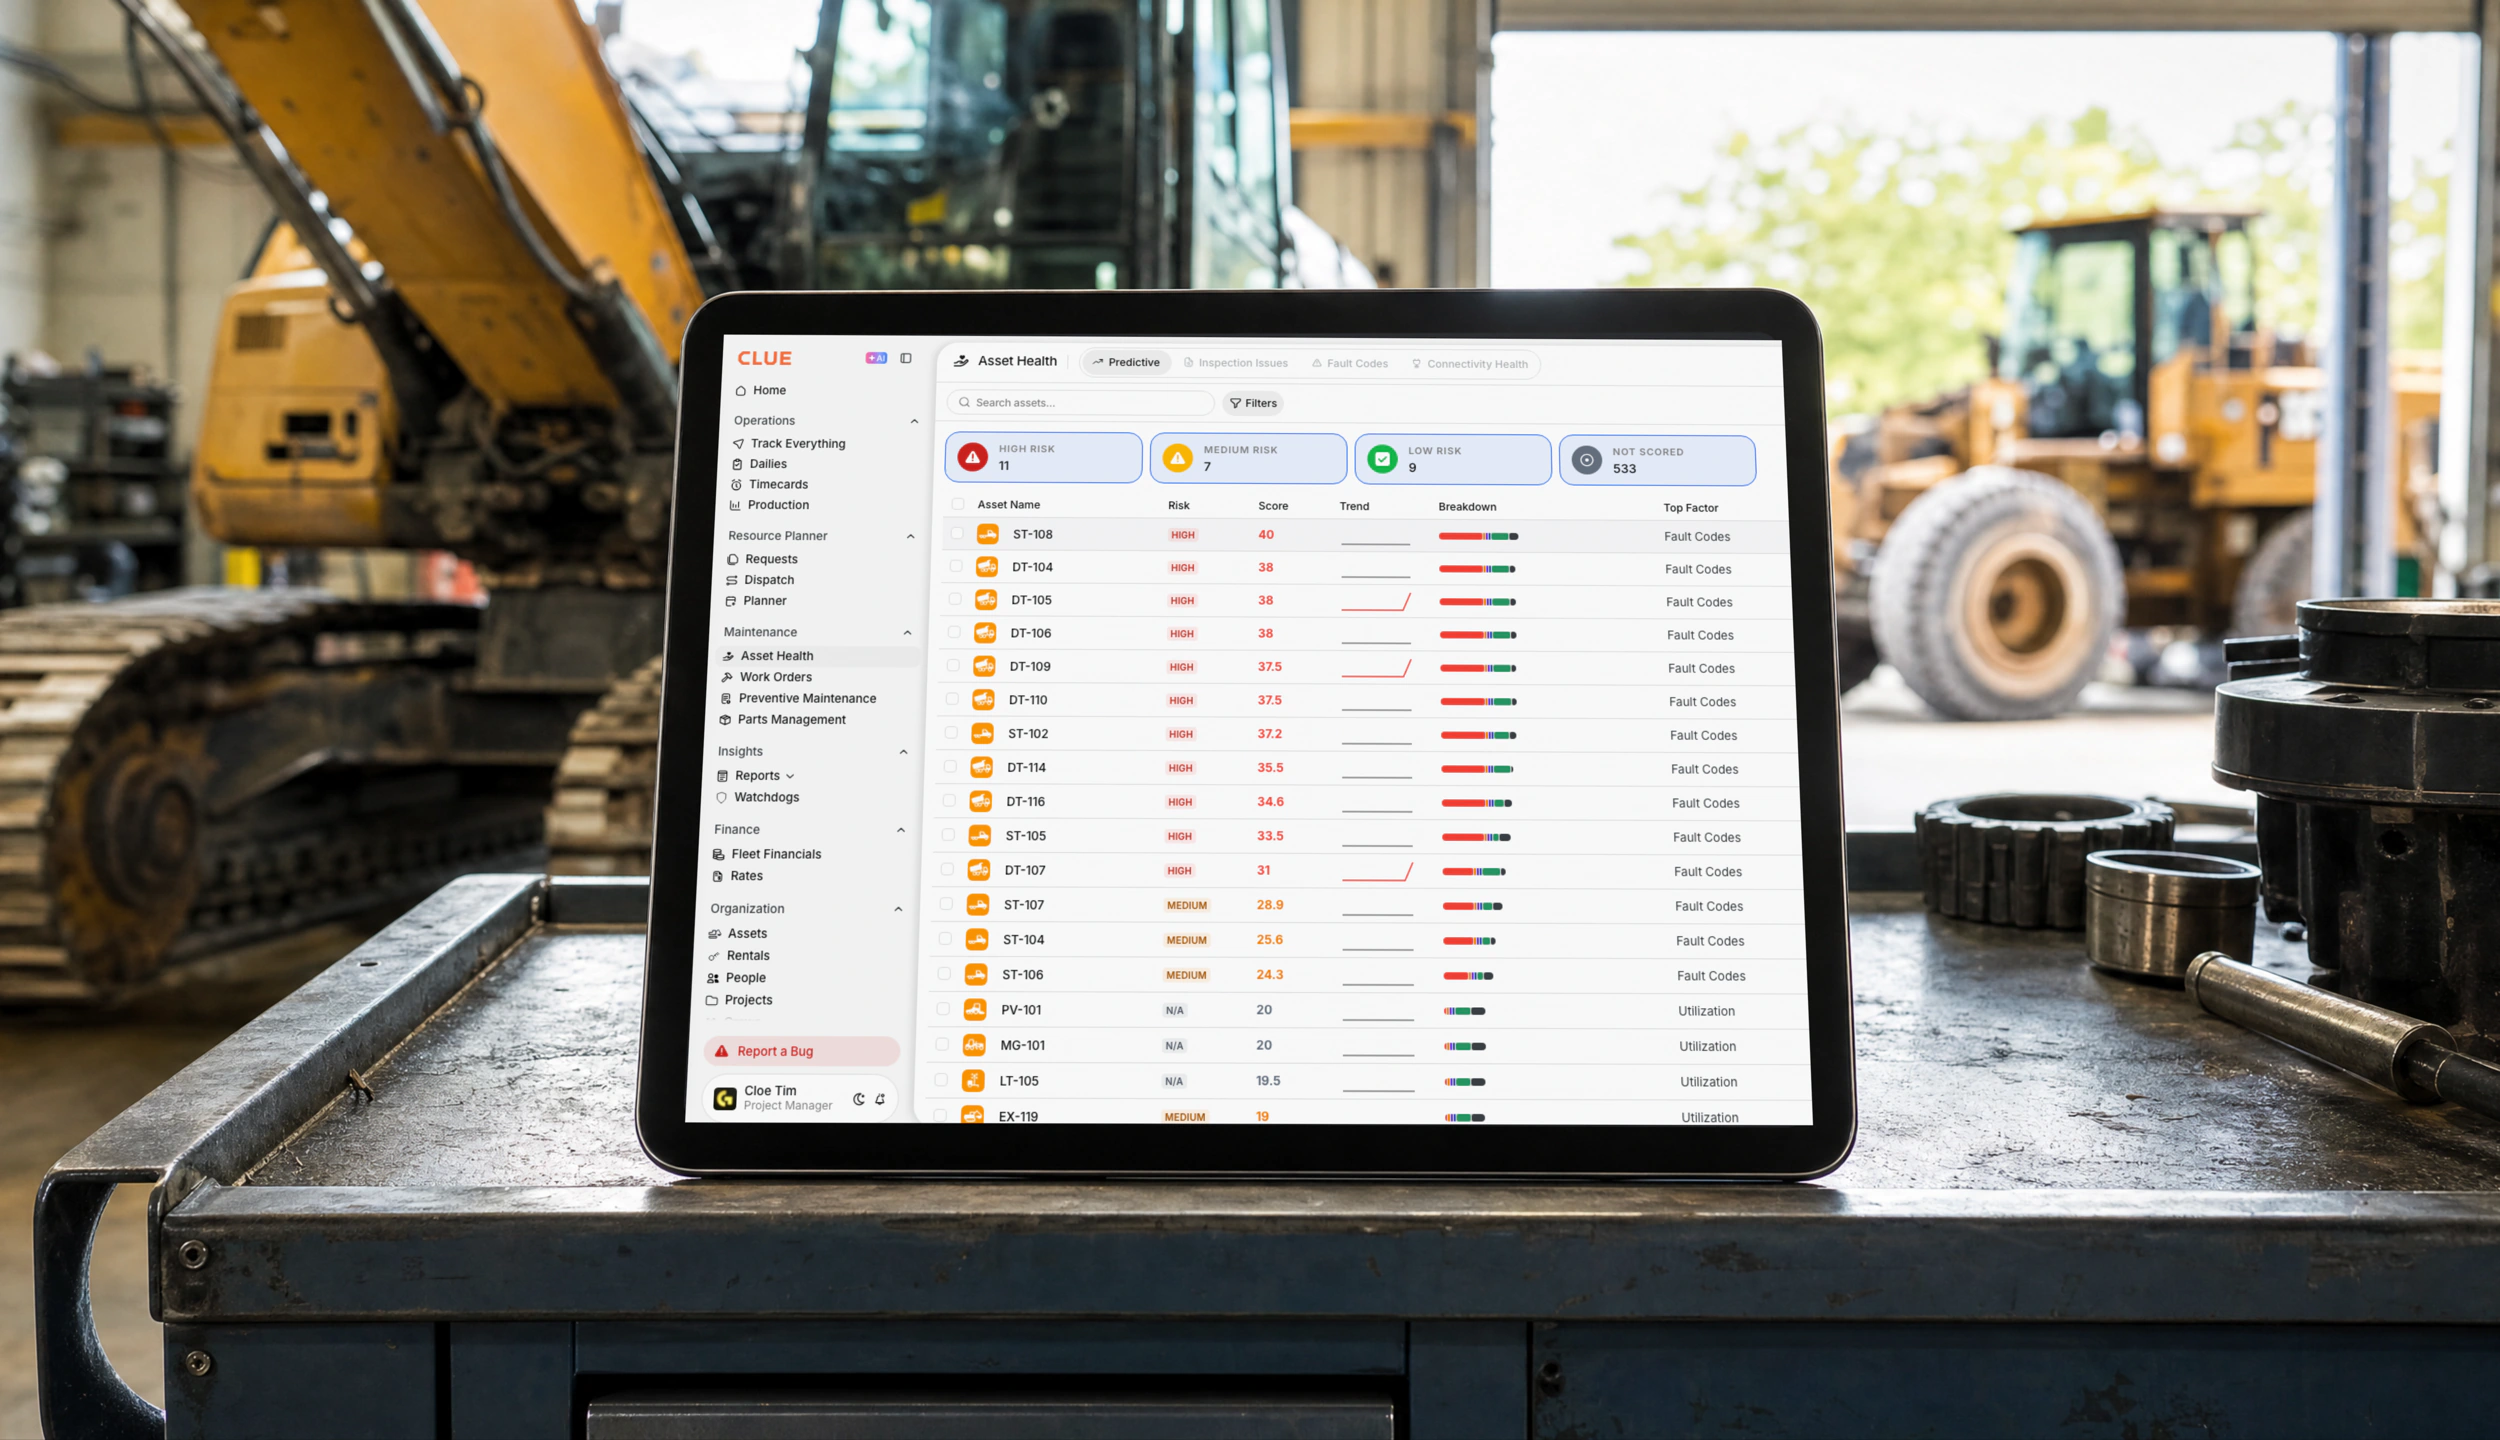
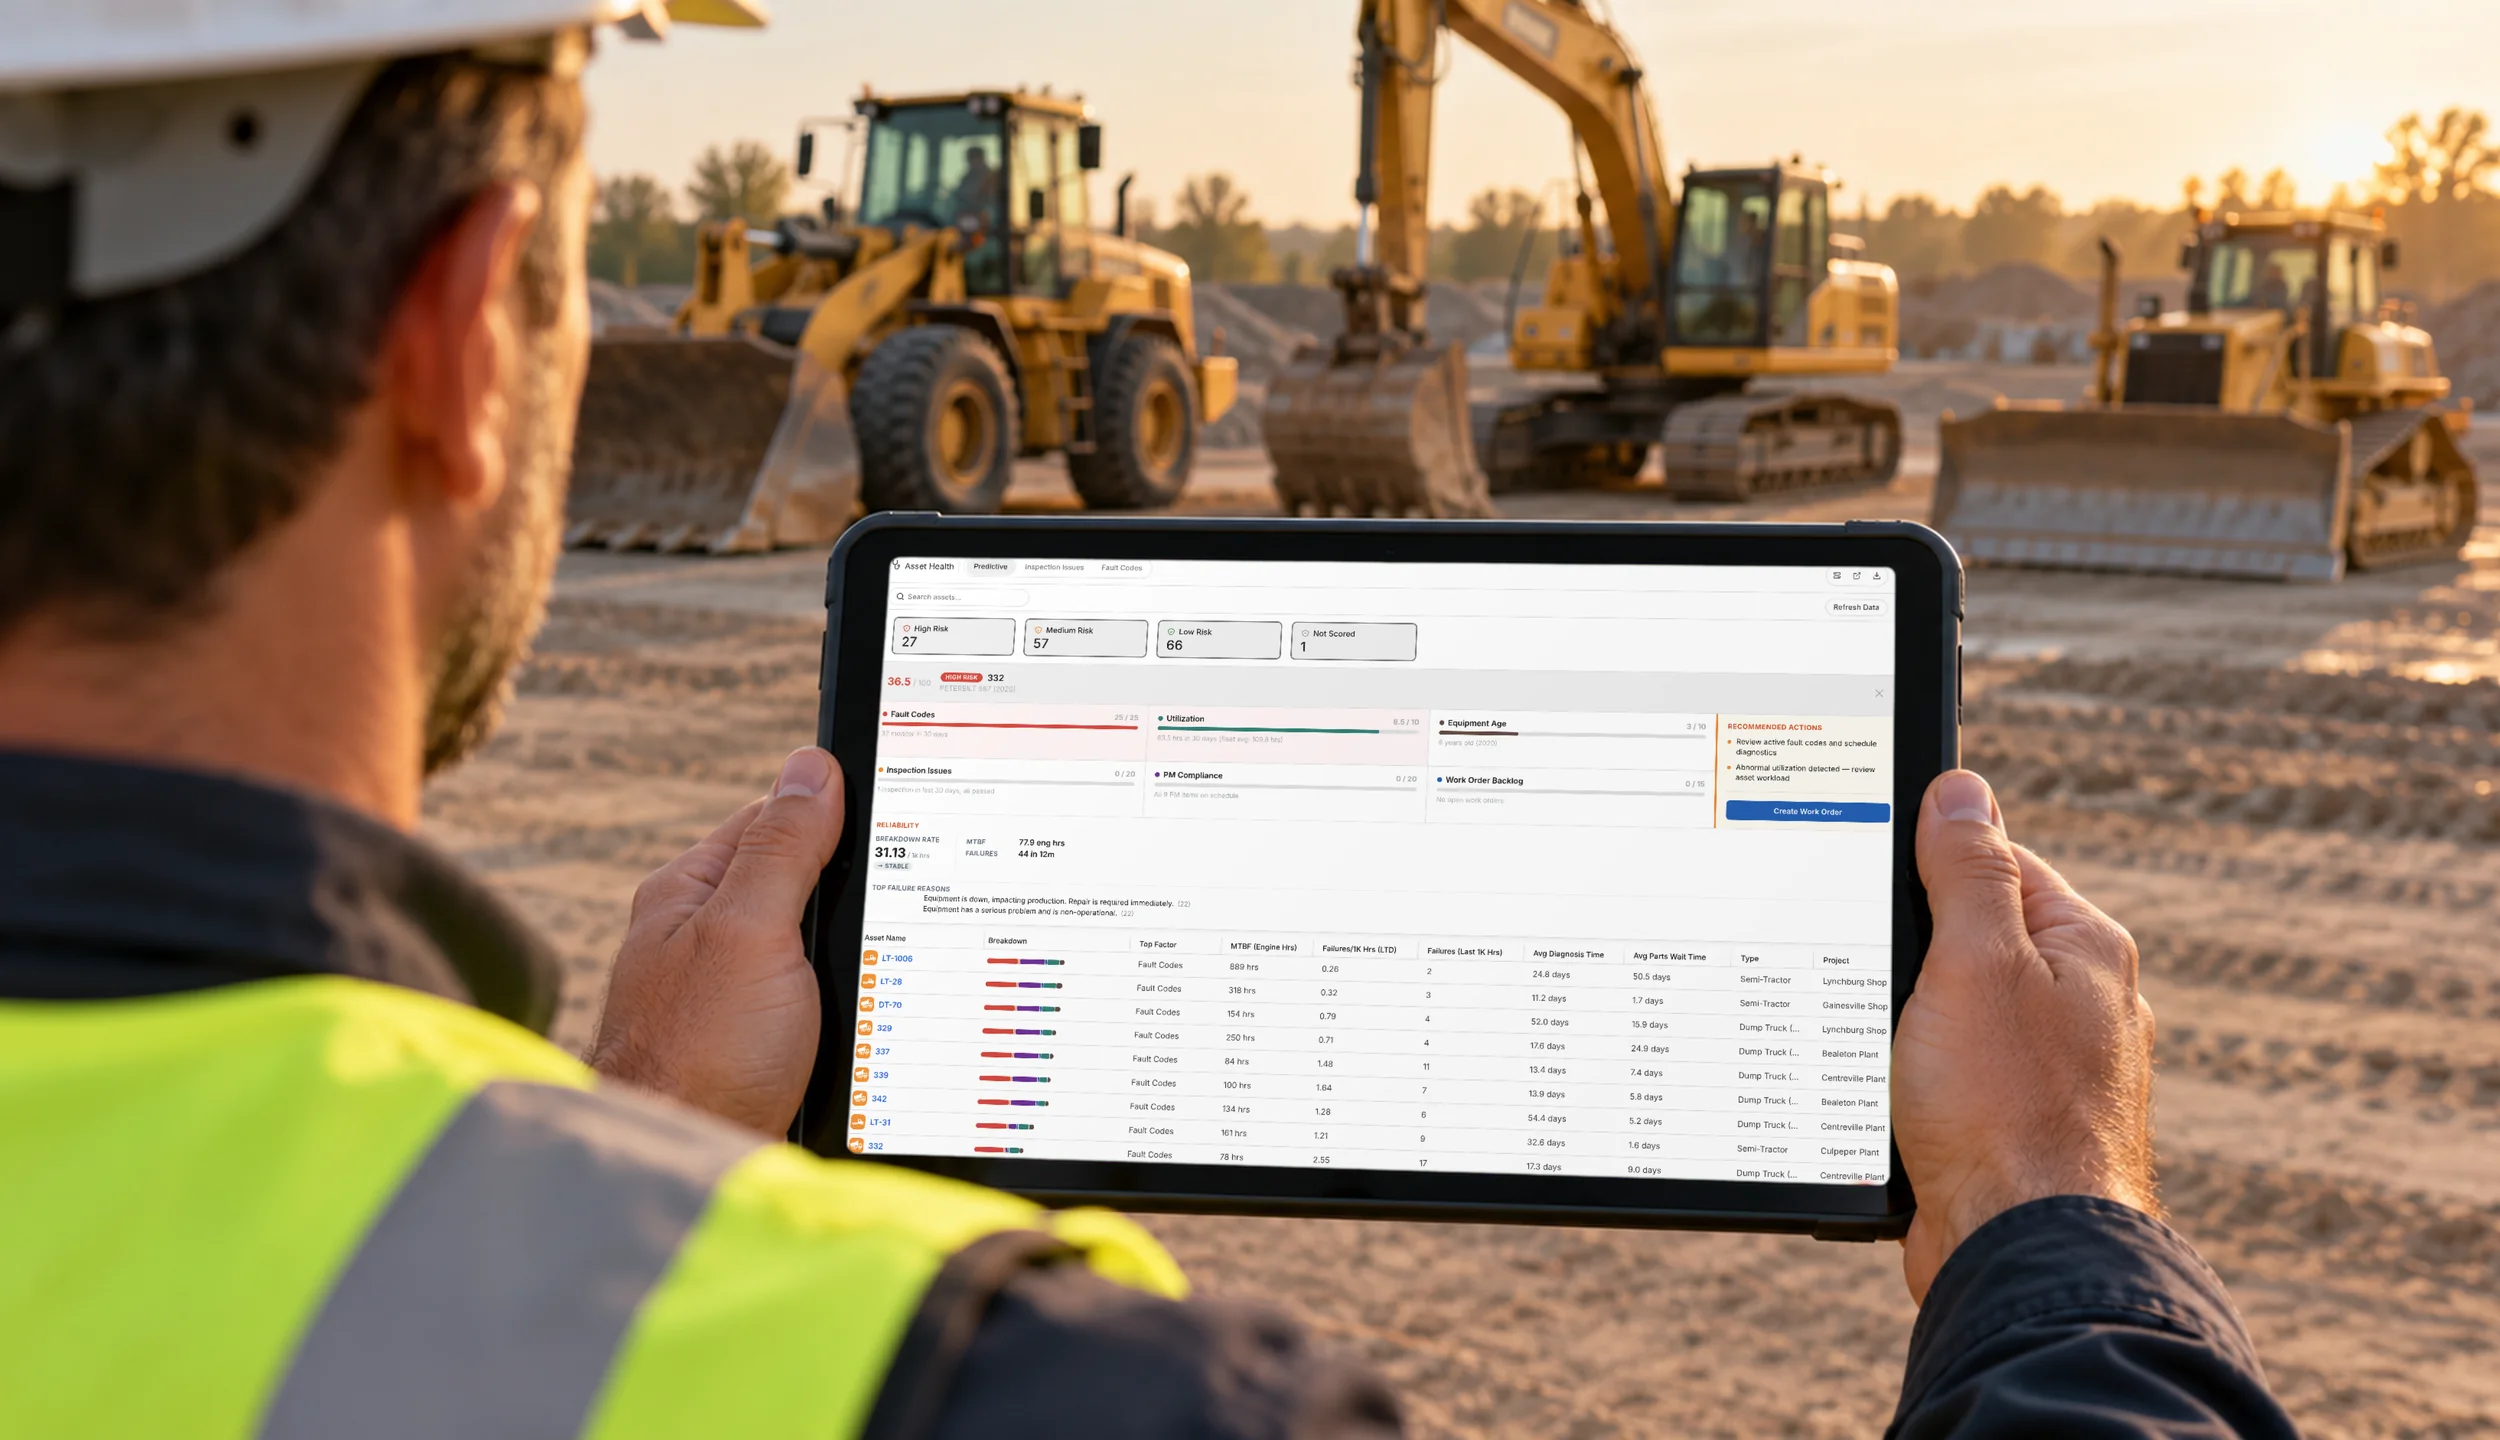
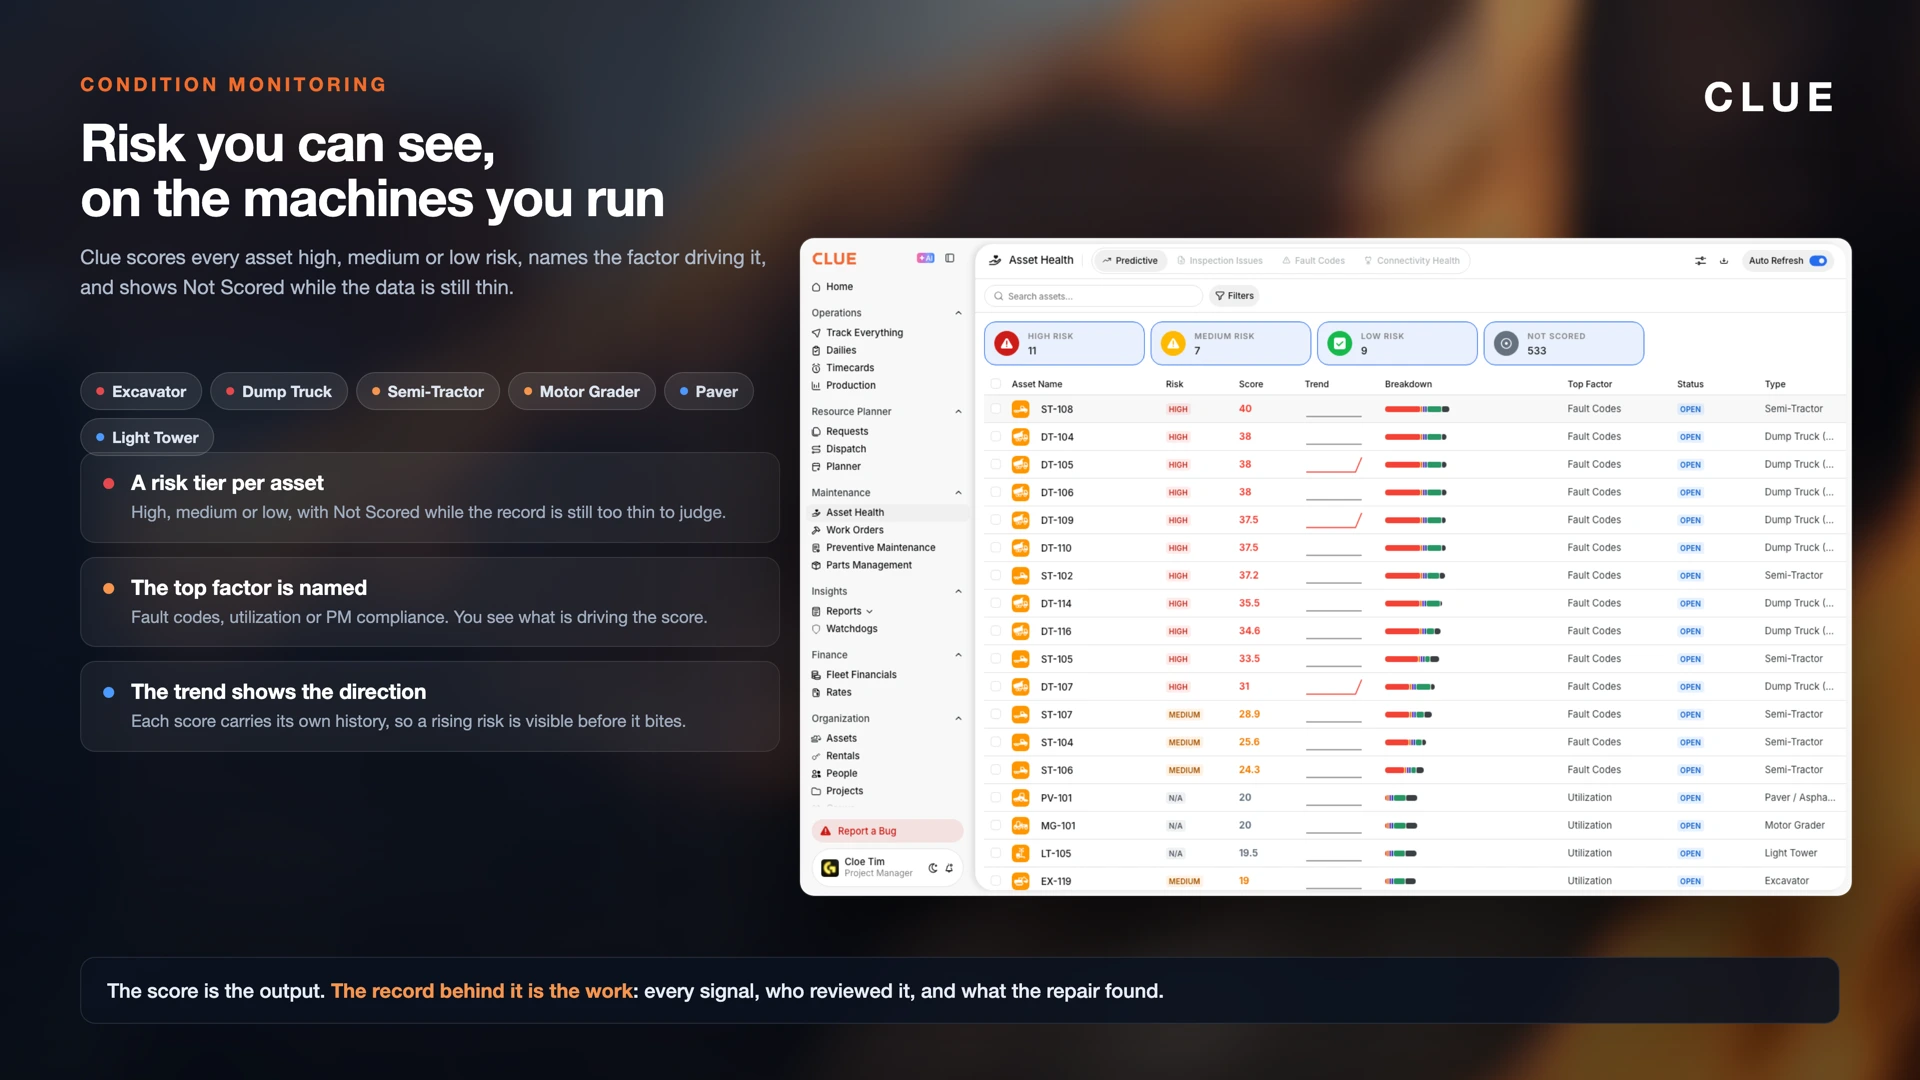
Asset Health scores assets as high, medium or low risk from their condition and maintenance data. It shows a “Not Scored” category when data is too thin, then tracks how each score changes over time on the predictive maintenance dashboard. That score history is what helps a team move from condition monitoring toward predictive maintenance.
Final Thoughts
The excavator in the opening example gave the team two signals and no connection between them. A yellow coolant warning for two weeks, and a “weeping hose” on a daily inspection.
This week, choose one asset with a repeat warning or inspection note. Name the person who reviews it. Record the next action and the outcome in one place. Repeat the process next week.
Condition monitoring starts with the data your fleet already has. A steady review habit builds the history your team needs to judge its next step. If Clue is on your shortlist, book a demo and bring your noisiest fault code list.
Frequently Asked Questions
How Does Condition Monitoring Contribute to Predictive Maintenance?
Condition monitoring creates the history predictive maintenance needs. Your team records the signal, the decision, the repair and the outcome against the right asset. Over time that record shows which changes tend to come before a failure. Without consistent records tied to repair outcomes, a prediction has little evidence behind it.
What Is the Difference Between Condition Monitoring and Predictive Maintenance?
Condition monitoring tells you the state of a machine today. Predictive maintenance estimates the state of that machine next month. Condition monitoring reports a fault once a signal crosses a line, so the fault already exists. Predictive maintenance reads the shape of the trend and aims to give notice before the line is crossed. Both use the same inputs. The difference is what you do with the history behind them.
What Are the Five Pillars of Condition Monitoring?
There is no official five-pillar framework for condition monitoring. Different sources name different fives. No standard uses the word pillars. ISO 17359:2018 lists seven parameters as examples: vibration, temperature, tribology, flow rate, contamination, power and speed. ISO 18436 certifies people across six disciplines. It has no part for electrical signature analysis, which is the fifth item on the most-quoted vendor list. The five techniques most often grouped together are vibration analysis, thermal imaging, oil and fluid analysis, ultrasonic testing and electrical readings. For a construction fleet the useful list is different again: telematics fault codes, engine hours and idle time, fuel and fluid use, oil sample results, daily inspection notes and tire pressure on connected trucks.
What Are Five Examples of Condition Monitoring Techniques?
Five examples of condition monitoring techniques are vibration analysis, which finds imbalance and bearing wear in rotating parts; infrared thermography, which finds heat from friction and loose connections; oil and fluid analysis, which finds wear metals and contamination; ultrasonic testing, which finds leaks and parts running without enough grease; and electrical signature analysis, which finds motor faults in the current a motor draws. Mobile equipment adds two more: telematics fault codes and daily inspection notes. Both are condition monitoring. Both arrive without a sensor purchase.
What Is the Difference Between Condition Monitoring and Condition-Based Maintenance?
Condition monitoring means watching equipment condition and recording changes. Condition-based maintenance is the strategy of doing maintenance when condition says work is due. Condition monitoring supplies the signal. The maintenance strategy defines the threshold, the owner and the action that follow.
What Are the 3 P’s of Maintenance?
The 3 P’s of maintenance refers to preventive, predictive and prescriptive maintenance. It is a common framing, not a standard. Preventive work follows a schedule. Predictive work uses trends to estimate a future need. Prescriptive maintenance suggests an action based on available data and analysis.
What Are the Disadvantages of Predictive Maintenance?
Predictive maintenance has four practical disadvantages. It needs a run of consistent history before it produces anything useful, so there is a waiting period with cost and no output. It needs asset IDs that match across telematics, inspections and shop records. It needs repair outcomes recorded with a failure mode, which is extra work at the end of a shift. It also produces a confident number. A confident number from thin data is worse than no number. Assets that run a handful of hours a year may never generate enough history to model.
Do I Need New Sensors to Start Condition Monitoring?
No. Start with signals you already collect, such as fault codes, engine hours, oil reports, inspections or connected truck tire pressure. Choose assets with useful records. Agree who reviews each signal and how the team records the result. Add sensors only when a clear data gap remains.
How Long Before Condition Data Supports Predictive Maintenance?
As a rule of thumb, plan to collect 6 to 12 months of consistent condition history on pilot assets. The time depends on the asset, the signal and the quality of the repair records. Tie every alert to an outcome. A long record without clear work results may not support useful predictions.
Is Condition Monitoring Worth It for a Small Fleet?
Yes, if your team reviews a few signals and acts on them. Start with one asset group and a short list of alerts, inspections or samples. Assign an owner to each signal. A simple, consistent process helps a small fleet learn what condition history it needs next.

Transform Your Equipment Management