Every machine gives off signals before it fails. A bearing runs a little hotter, a pump vibrates in a different pattern, oil picks up metal particles nobody can see. IoT predictive maintenance is the practice of reading those signals with connected sensors and acting on them before the machine stops.
The promise is real. For high-value equipment it is one of the most effective ways to cut unplanned downtime. The category is also noisy with hype, and for a construction fleet most of the standard advice points in the wrong direction.
This guide explains how sensor data prevents equipment failure and what the sensors measure. It also covers where the programs go wrong, and why a heavy-equipment fleet usually already owns most of the sensors it needs. It assumes you already run some form of construction equipment preventive maintenance software and want to know what connected sensors add to it.
This page is about the signal. If you are comparing products rather than sensors, the predictive maintenance software buyer's guide covers features, pricing models and vendor questions in detail. That guide also covers how to judge a vendor's fault-code normalization. This page covers the fields and signals underneath it.
What Is IoT Predictive Maintenance, and How Does It Work?
IoT predictive maintenance uses connected sensors and analytics to read a machine's real condition and forecast a failure before it happens. Repairs get scheduled on evidence from the equipment, not on a calendar and not on a breakdown.
The "IoT" part means the sensors are connected. They send condition data to a system that can analyze it. The alternative is a technician walking the yard with a handheld meter once a month.
Reading condition instead of a calendar is what the industry calls condition-based maintenance. Predictive maintenance is the version of it that forecasts a reading, rather than just reacting to one.
The Four-Layer Pipeline
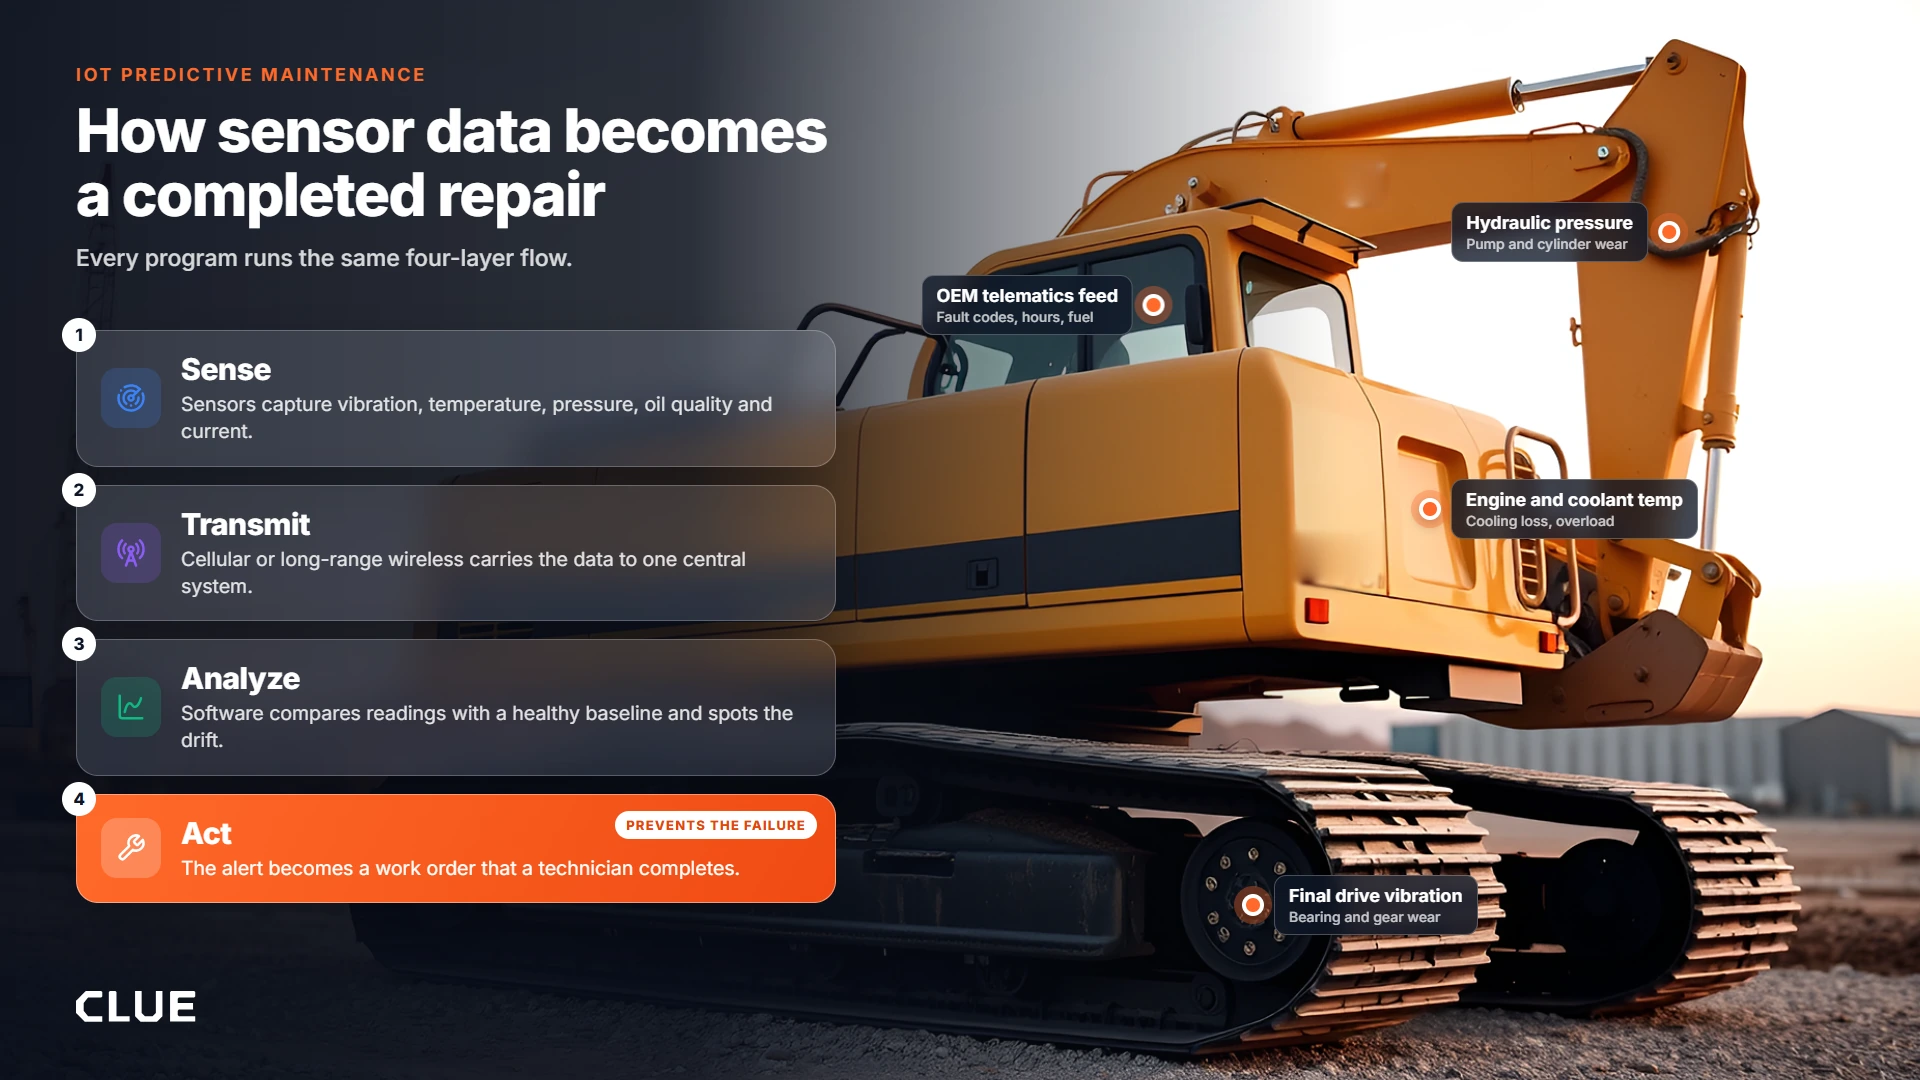
Underneath the jargon, every IoT predictive maintenance program is the same four-step flow:
- Sense: Sensors on the equipment capture condition data. Vibration, temperature, pressure, oil quality, electrical current.
- Transmit: That data travels from the machine to a centralized system. In the field that usually means cellular or a long-range wireless network.
- Analyze: Software compares the incoming data against a baseline for a healthy machine of that type, then looks for the drift that precedes a failure.
- Act: When it finds the pattern, it raises an alert tied to a specific component and timeframe. That alert becomes a work order.
That last step is the one that matters and the one most programs underinvest in. Sensing a problem is not the same as preventing a failure. The failure is only prevented when the alert turns into a scheduled repair a technician completes.
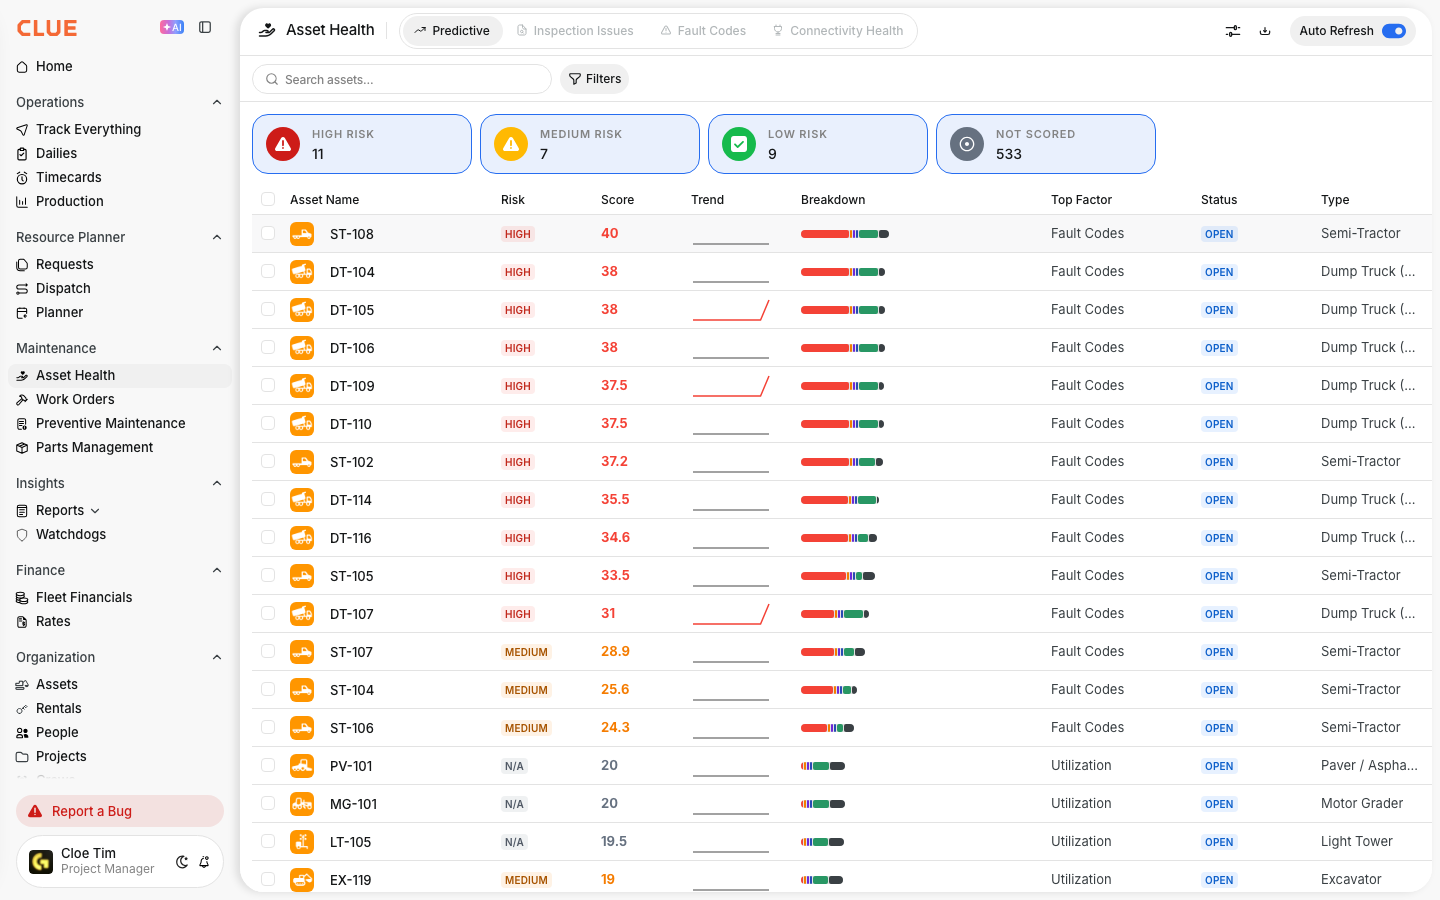
Clue is built around that final step. It ingests the condition data and scores each machine's failure risk. The result goes into a work order in the queue your shop already uses, instead of onto a dashboard for someone to notice. Everything before "act" is cost. Only "act" is value.
That four-layer shape is the same one every connected fleet runs on. For the wider operational version, see IoT fleet management for construction fleets.
What Do IoT Sensors Actually Measure on Equipment?
IoT sensors measure the physical signals that change as a machine wears. Each sensor type is tuned to a different family of failures, which is why matching the sensor to the failure mode is the whole game. There is no single "predictive sensor." There is a toolkit, and the wrong tool produces confident data about the wrong thing.
The Core Sensor Types
- Vibration: The workhorse of the category and the most widely deployed type. Vibration sensors catch bearing wear, misalignment and imbalance on rotating parts. Low-cost MEMS versions have made them cheap enough to put almost anywhere.
- Oil analysis: Often the earliest warning. A single result showing elevated metal particles can flag an engine or bearing problem long before any other symptom appears. It catches failure modes vibration cannot see.
- Temperature: Rising heat is a near-universal symptom of friction, overload or cooling trouble. That is why temperature is usually paired with other sensors rather than used alone.
- Pressure: Critical for hydraulic systems, where a drift in pressure signals a developing problem long before a failure on a job site.
- Acoustic and ultrasonic: Detect the high-frequency sounds of leaks, electrical arcing and early bearing defects that fall outside normal hearing.
- Current and power: Reveal electrical and load anomalies. They can infer mechanical problems in a motor without touching the rotating parts.
Match the Signal to the Failure Mode
The most common technical mistake is putting the wrong sensor on an asset. Vibration sensors on a hydraulic circuit produce a clean stream of data about the wrong thing. More sensors is not more insight. Use this as the starting map, then correct it with your own failure history.
| Signal | What it detects | Typical heavy-equipment failures it sees | Where the signal comes from | How early it warns |
|---|---|---|---|---|
| Vibration (MEMS or piezo accelerometer) | Bearing wear, misalignment, imbalance, gear damage | Final drive, swing bearing, pump drive, crusher and screen bearings | Add-on sensor. Rarely in the OEM feed | Early |
| Oil and fluid analysis | Metal particles, water, fuel dilution, additive depletion | Engine, hydraulic pump, final drive, transmission | Lab sample. Some OEM programs schedule it | Early |
| Ultrasonic and acoustic | High-frequency leak and arcing noise, early bearing defects | Air and hydraulic leaks, valve passing, electrical faults | Add-on sensor or handheld | Early to mid |
| Hydraulic pressure and temperature | Pressure drift, overheating, restriction | Pump and motor wear, relief valve, cooler fouling, cylinder drift | Often in the OEM feed on newer machines | Mid |
| Engine and coolant temperature | Friction, overload, cooling loss | Radiator fouling, water pump, thermostat, head gasket | OEM feed | Mid |
| Load factor, cycle count, payload | Duty severity and abuse | Nothing directly. It is the context every other signal needs | OEM feed, ISO/TS 15143-3 fields | Context, not a fault |
| Fuel burn per working hour | Efficiency drift | Injectors, aftertreatment, air restriction, hydraulic inefficiency | OEM feed | Mid |
| Diagnostic trouble codes (SPN and FMI) | A fault the ECU already decided is a fault | Any monitored circuit on the machine | OEM feed, CAN bus | Late |
| Operator report and inspection finding | Everything a sensor is not watching | Structural cracks, cutting edges, tires, tracks, leaks, glass, guards | Your inspection form | Varies. Often the only signal there is |
Two things follow from the table.
First, the signals a construction fleet already receives sit in the middle and at the late end. The OEM feed is strong on load, temperature, fuel and fault codes. It is weak on vibration and oil. That is where an add-on sensor earns its place.
Second, the last row matters as much as the rest. Many heavy-equipment failures start somewhere no sensor is pointed. Structural cracks, cutting edges and worn tracks are found by a person, not a signal. An inspection program is part of the predictive stack, not an alternative to it. The common causes of equipment failure are worth reading against your own history before you buy anything.
Does Heavy Equipment Need IoT Sensors, or Does It Already Have Them?
For most modern heavy equipment the IoT sensors are already on the machine. OEM telematics is the IoT layer, so a construction fleet's predictive maintenance project is usually about unifying data it already generates rather than bolting on new hardware. This is the most overlooked fact in the topic, and it flips the standard "go buy sensors" advice for a yellow-iron fleet.
The Sensors Are Already Broadcasting
Modern heavy equipment reports its own condition in two documented ways. On the machine, engine and driveline faults ride the CAN bus as J1939 codes. Each code pairs a suspect parameter number with a failure mode identifier, so it names both the part and the way it is failing. Off the machine, OEM telematics programs such as Cat Product Link, Komatsu KOMTRAX, John Deere JDLink and Volvo CareTrack carry that data to a server. There, ISO/TS 15143-3:2020 defines a common set of fields any application can request.
If you want to read the codes themselves, start with SPN, FMI, CID and MID codes and how to decipher them. For how the feed itself works across brands, see OEM telematics.
The data is already being collected. The question is whether your maintenance system reads it, or whether it sits in a manufacturer portal nobody logs into.
Where Add-On Sensors Still Earn Their Place
This does not mean aftermarket sensors are pointless. They earn their place in three situations:
- Older iron with no factory telematics, where an aftermarket device adds the basic condition and location data the machine cannot provide on its own.
- Construction-specific needs the OEM feed does not cover, such as external fuel sensors for theft detection, or hydraulic-pressure and operator-ID sensors for event-driven workflows.
- Deep, single-asset monitoring on a critical machine, where dedicated vibration or oil sensors go beyond what the OEM broadcasts.
One Portal Per Brand
OEM telematics has a built-in limitation for construction. Each brand's data lives in that brand's portal. A mixed fleet of Cat, Komatsu, Deere and Volvo machines means four portals, four logins and no single picture. Call it the portal-hopping problem.
Most fleets land on the same pattern. Factory feed on newer machines, aftermarket devices on older equipment and light trucks, then everything unified in one system. That unification, not the sensors, is the actual work.
The Standard That Makes a Mixed Fleet Readable
There is a published standard for this. ISO/TS 15143-3:2020, "Earth-moving machinery and mobile road construction machinery. Worksite data exchange. Part 3: Telematics data," defines a single web schema for pulling machine status out of any telematics provider's server. The equipment industry knows it as AEM/AEMP 2.0. It was written by ISO technical committee TC 127. The 2020 edition replaced the 2016 one.
Its scope is exact. It covers the request and response between a telematics server and your application. It does not cover the on-board CAN bus or how the data reaches the provider. That is the right boundary for a fleet owner. You are not rewiring machines. You are asking four vendors for the same fields in the same shape.
Clauses 11.2 to 11.21 define twenty data-field groups: one machine header block and nineteen telematics fields. These are the fields a mixed fleet can ask every brand for.
| ISO/TS 15143-3:2020 field | What it tells a maintenance planner |
|---|---|
| Machine header: make, model, equipment ID, serial number, OEM ISO identifier (PIN or VIN) | Ties the data to one asset record instead of one portal login |
| Last known location | Where the repair has to travel to |
| Operating hours | The clock almost every PM interval runs on |
| Cumulative idle operating hours | Hours burned without work. Wear with no revenue |
| Cumulative idle non-operating hours | Separates idling from sitting |
| Cumulative fuel used | Fuel per working hour is an early drift signal |
| Fuel used in the preceding 24 hours | Day-over-day change on the same duty cycle |
| Fuel remaining ratio and tank capacity | Fuel planning. Also theft investigation |
| Percent of DEF remaining and tank capacity | A stranded machine is downtime with no fault code |
| Cumulative distance traveled | Wear basis for wheeled iron |
| Caution codes referencing number | Operator-facing warnings, with an IEC/ISO symbol reference |
| Engine condition and engine number | Running state per engine on multi-engine machines |
| Average daily engine load factor | How hard it worked. Load context for every other reading |
| Peak daily speed | Abuse and over-speed events |
| Cumulative load count | Cycle count, the real wear basis on a loader |
| Cumulative payload total | Tonnage moved. Wear basis and production in one field |
| Cumulative power take-off hours | Hours on the attachment, not the carrier |
| Cumulative non-productive regeneration hours | Aftertreatment trouble, visible before it becomes a derate |
| Digital input state | Operator switches and aftermarket inputs |
| Diagnostic trouble codes: identifier, severity, description, code source, ambient air temperature at trigger | The fault itself, plus the condition it happened in |
Ask every telematics vendor two questions. Do you serve ISO/TS 15143-3? Which of these fields do you populate? Support for the standard does not guarantee every field is filled. Coverage varies by model, by telematics unit and by data plan. Get the answer field by field, in writing, before you sign.
For how the same standard fits into a wider telematics rollout, see heavy equipment telematics in construction. For how it shapes a software shortlist, see the predictive maintenance software buyer's guide.

Why Do IoT Predictive Maintenance Programs Fail?
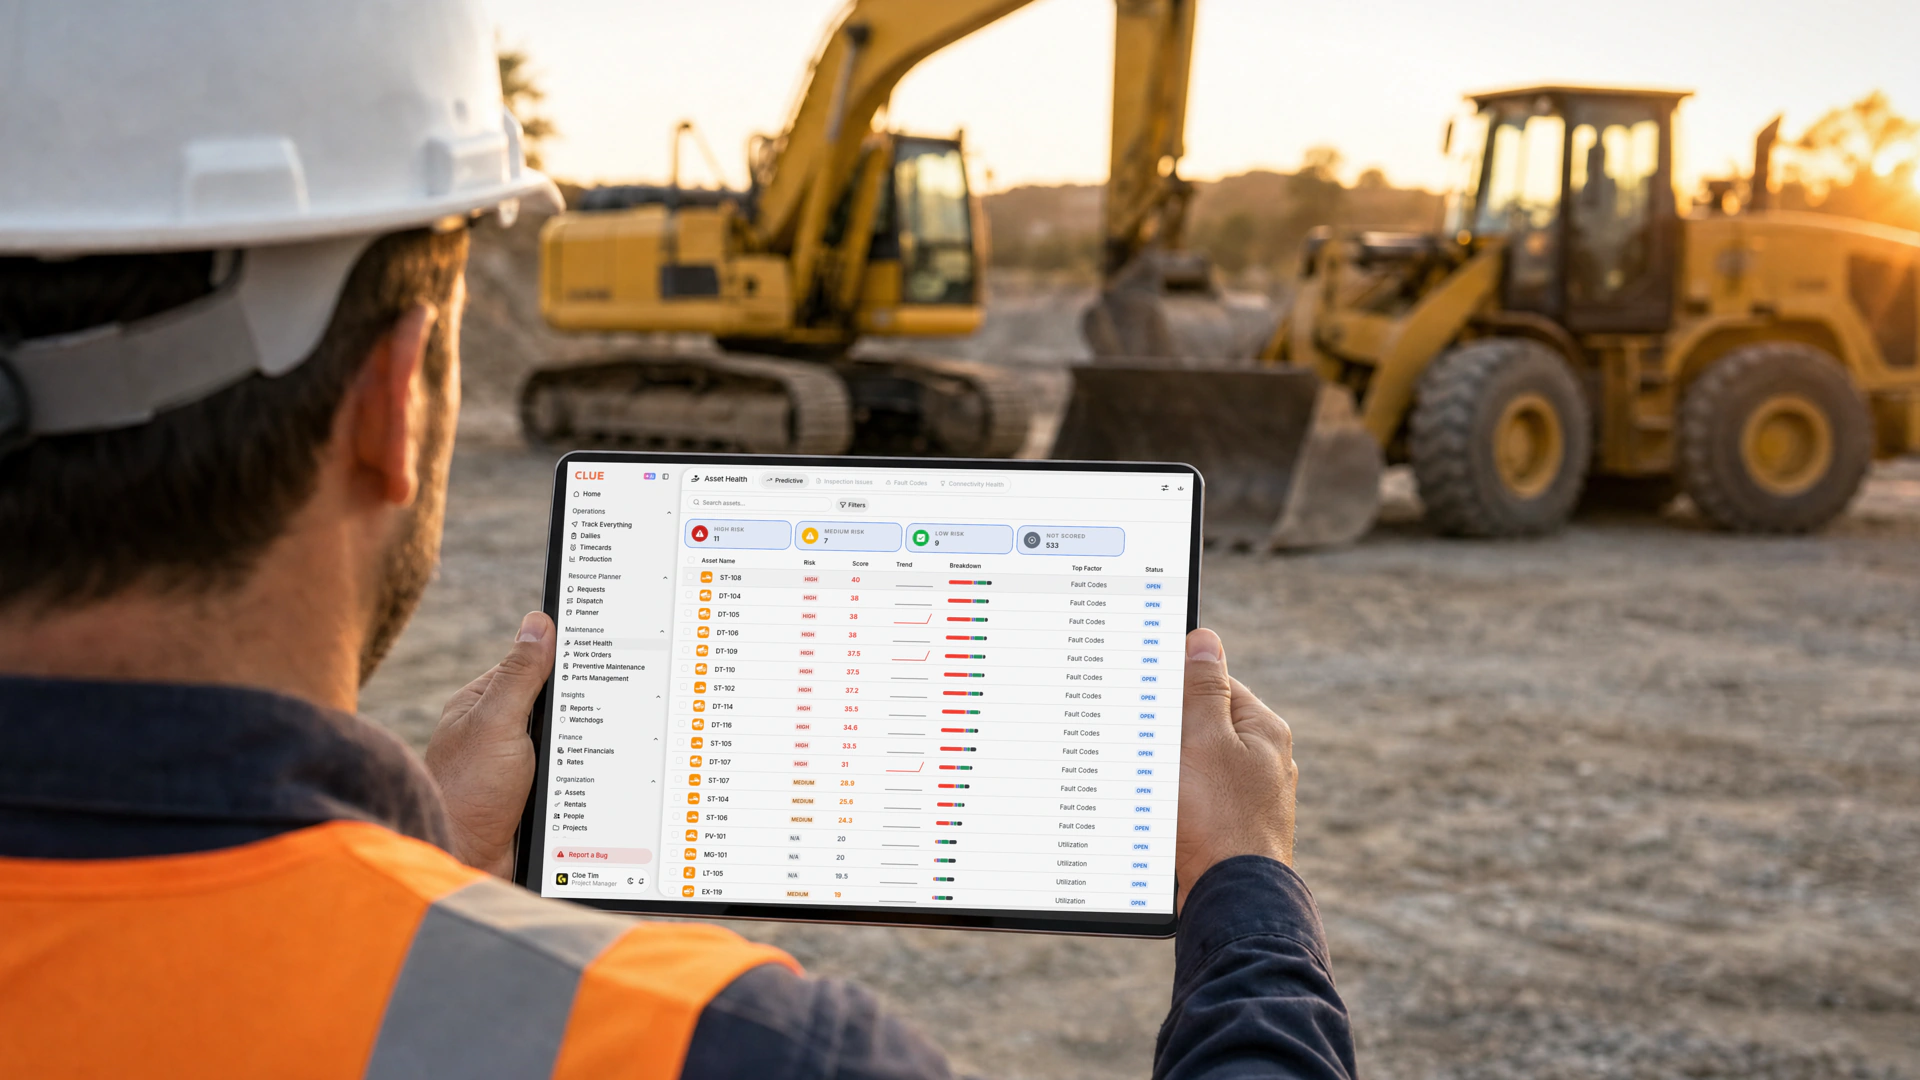
IoT predictive maintenance programs fail far more often on false alarms than on missed failures. A flood of alerts that turn out to be nothing trains technicians to ignore the system, and an ignored alert prevents no failures at all.
This is the failure mode the sensor marketing never leads with. It is the one experienced reliability teams worry about first.
False Alarms Are the Dominant Problem
Process industries worked this out decades ago and wrote it down. EEMUA 191, "Alarm systems: a guide to design, management and procurement," sets a workable load at about one alarm every ten minutes per operator in normal running. During an upset it allows no more than ten in any ten-minute window. ANSI/ISA-18.2, "Management of Alarm Systems for the Process Industries," adds a limit of about ten standing alarms at any time.
Those numbers describe a control-room operator watching a plant, not a shop foreman with a phone. Do not treat them as your target. Treat them as the order of magnitude a human can absorb. Count what your condition-monitoring system sent your shop last week and see which side of that line you are on.
The root cause is usually simple and fixable. Most sensors fire on fixed thresholds that ignore how the machine is being run. A loader cycling at full load and the same loader idling do not share a normal. One threshold for both guarantees false alarms.
How to Keep Alerts Trustworthy
The fixes are known. They are what separate a program that lasts from one that gets switched off:
- Validate across multiple signals: A real fault usually shows up on more than one channel. Confirm a vibration anomaly against temperature, current or ultrasonic data. True faults show on several signals. False ones do not.
- Account for operating context: Tie data collection to the machine's operating state. Readings taken under load and at idle are not comparable, and ignoring that multiplies false alarms.
- Let technicians close the loop: Give the crew a fast way to tag an alert as a false positive, so the system tightens over time instead of crying wolf.
- Specify the sensor for the environment: A sensor chosen for a clean plant floor reads a tracked machine on broken ground as a constant fault. Match the measuring range and the mounting to the duty before you blame the software.
The goal is not the most alerts. It is alerts your people believe. A predictive program lives or dies on trust.
Can Sensor Data Really Predict a Failure Before It Happens?
Sensor data can predict many failures with real lead time, but only when it is more than a threshold alarm. A basic sensor that fires once a reading goes abnormal often gives you days, not the weeks you need to schedule around a planned shutdown.
This is an honest limitation worth understanding before you buy. It is the difference between a smarter warning light and genuine prediction.
Threshold Alarms Versus True Prediction
A naive IoT setup watches for a reading to cross a line. High temperature, high vibration, alert. The problem is timing. By the time an abnormal condition appears, the equipment can already be close to failure. That is often too late to fit the repair into a planned maintenance window.
Genuine prediction looks earlier, at the pattern that precedes the abnormal reading. It combines live sensor data with the machine's history to forecast a failure well before a simple threshold would trip.
Ask for the P-F Interval, Not the Alert
Reliability engineers have a name for the thing you are buying. On the P-F curve, P is the point where a developing failure first becomes detectable. F is functional failure, where the machine stops doing its job. The gap between them is the P-F interval. It is the part of a predictive system a planner can actually use.
Different signals sit at different points on that curve. Oil analysis and vibration pick up a bearing or a pump going bad early. A diagnostic trouble code sits close to F, because by the time the ECU raises it the condition is already out of range. That is why a fault-code feed alone is a better warning light, not prediction.
The planning rule comes from reliability-centered maintenance, and it is stricter than it sounds. You have to inspect at least twice inside the interval, so the check runs no less often than half the P-F interval. If vibration gives twelve weeks of warning on a bearing, check it every six. Checking every ten weeks is not twice as safe as every twelve. It can miss the window entirely.
That rule cuts both ways. A monthly oil sample is useless against a failure that develops in two weeks. A continuous vibration feed is wasted on a failure mode that takes six months. Match the check frequency to the interval, per failure mode, and the program stops being a guess.
So when a vendor demos an alert, ask one question. On this failure mode, how long is the gap between the first signal and the breakdown? If the answer is a feature list, you are being sold a threshold alarm.
History Matters as Much as Sensors
Sensors tell you the present. History tells you what the present means. A predictive model needs documented maintenance history per machine to learn which patterns led to failures. A fleet with years of clean service records gets more out of IoT data than one starting from scratch.
This is also why the sensor layer and the maintenance system cannot be separated. The condition data and the repair history have to live together for the prediction to be any good. A standalone sensor dashboard with no maintenance history behind it is working with half the information.
What Does the Evidence Actually Show?
The best public measurement of predictive maintenance is a survey of 71 manufacturers run by the National Institute of Standards and Technology, published in 2021. It is manufacturing, not construction. Read it as direction, not as your number.
| Finding | Figure | Compared against |
|---|---|---|
| Unplanned downtime | 52.7% less | Firms leaning on predictive and preventive, against firms leaning on reactive |
| Defects | 78.5% fewer | Same comparison |
| Lost sales | 49.4% to 73.0% less | Same comparison |
| Inventory increase caused by maintenance | 51.2% less | Same comparison |
| Direct maintenance spend | 81.7% more | Same comparison. The same sentence that reports the gains reports this cost |
| Unplanned downtime | 18.5% less | Within that group, predictive-leaning against preventive-leaning |
| Defects | 87.3% fewer | Within that group, predictive-leaning against preventive-leaning |
Source: Douglas Thomas and Brian Weiss, "Maintenance Costs and Advanced Maintenance Techniques in Manufacturing Machinery: Survey and Analysis," International Journal of Prognostics and Health Management, vol. 12, no. 1, 2021. Sample size 71. Full text.
Most write-ups of this survey quote the first four rows and stop. The fifth row is in the same sentence as the third. Firms that moved away from reactive maintenance spent more on maintenance, not less. They lost less production. That is the real trade, and it is the one to put in front of a finance director.
Two more cautions before you carry any of it into a budget. The survey measures plant machinery on a fixed floor, not mobile iron on a job site. It compares firms that lean one way against firms that lean another, which is not the same as measuring what happens when one fleet switches. Treat the direction as well evidenced. Treat the size as someone else's number.
How Much Does IoT Predictive Maintenance Cost?
The cost of IoT predictive maintenance depends on whether you are buying sensors or using the ones you already have. That is why a heavy-equipment fleet can often start for far less than the sensor-heavy industrial playbook suggests.
Treat any published figure as orientation. Verify it against quotes for your own equipment, because the ranges in the market are wide.
What Drives the Cost
The spend breaks into a few buckets:
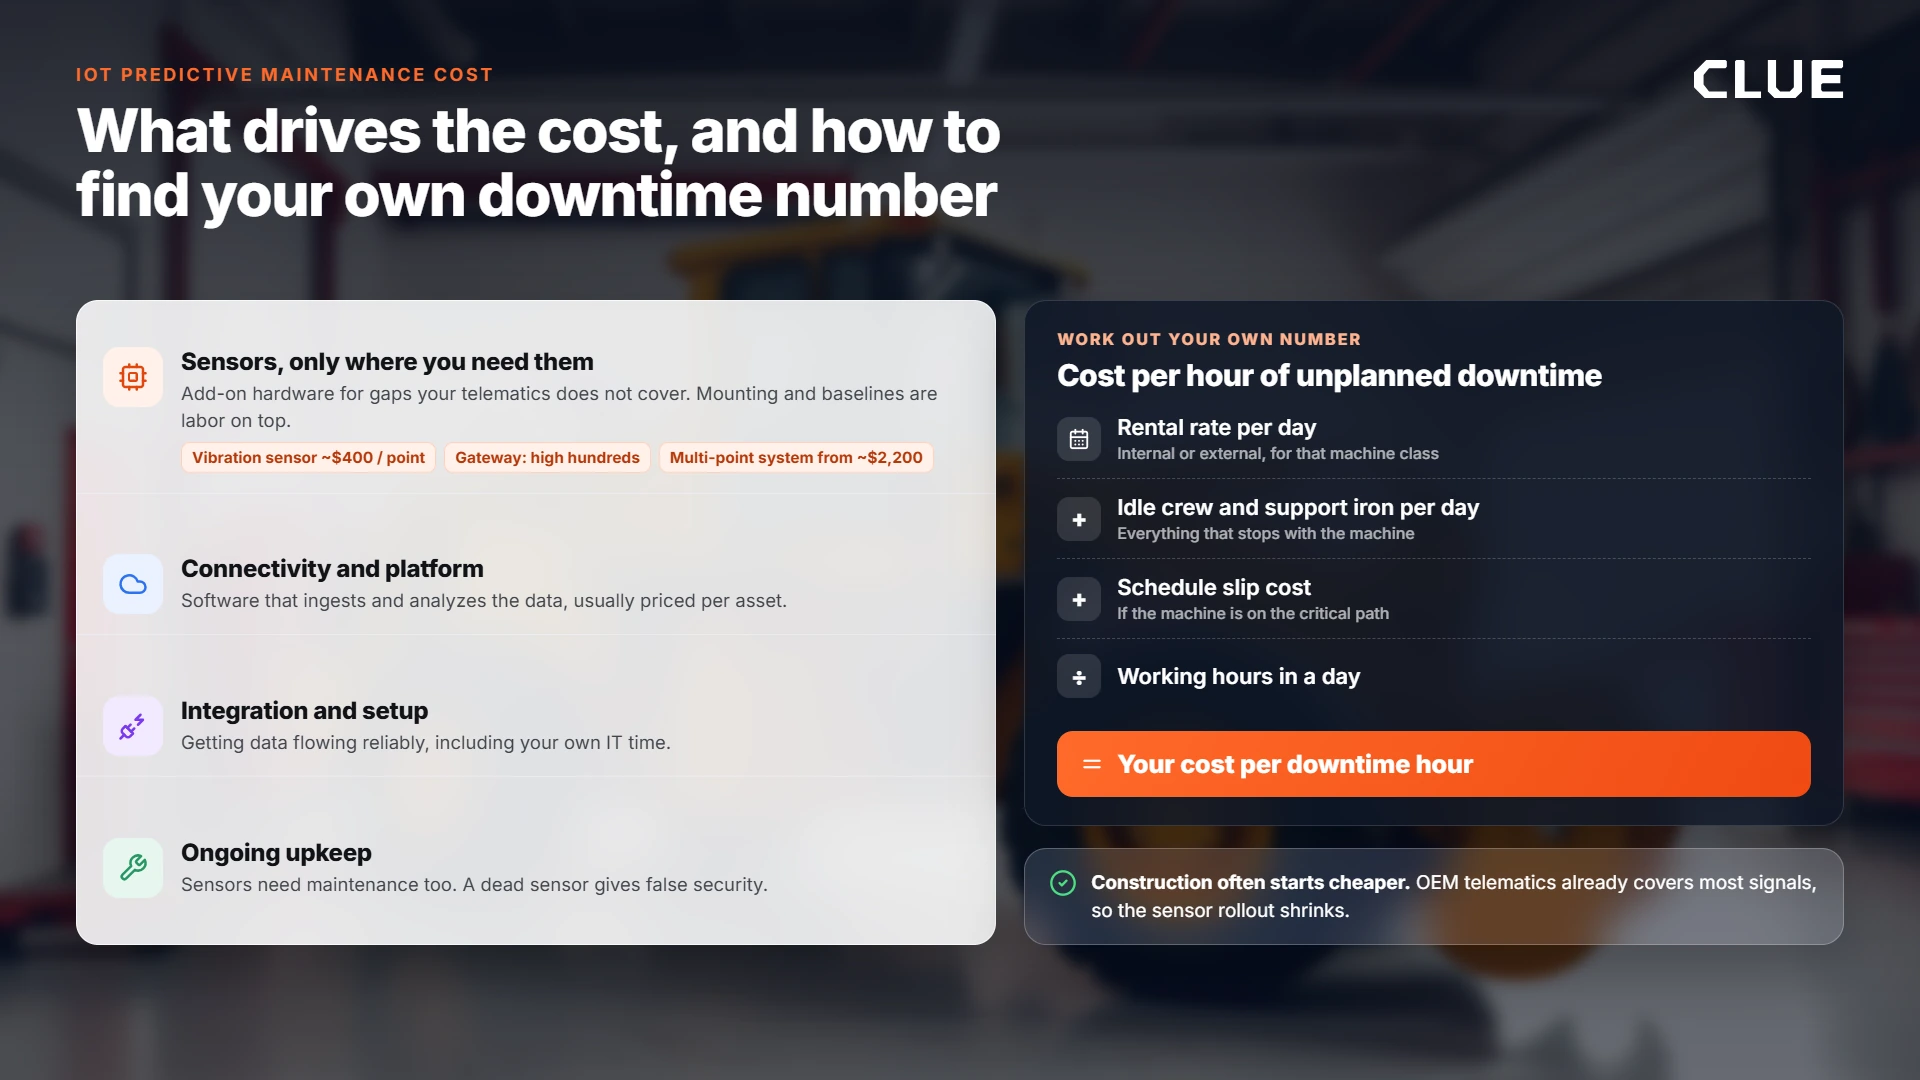
- Sensors: Only where you need them. Industrial wireless vibration sensors list from around $400 per point at distribution. A gateway to collect them is a separate line in the high hundreds. A packaged multi-point monitoring system lists from around $2,200. Mounting, baseline capture and threshold setting are labor on top. Treat anything priced under $100 as consumer hardware and check its rating before it goes on a machine. List prices move, so get a current quote for your own point count.
- Connectivity and platform: The software that ingests, stores and analyzes the data. Usually a subscription priced per asset.
- Integration and setup: Getting data to flow reliably from machine to platform, including your own IT time, which never appears on a sensor quote.
- Ongoing upkeep: Sensors need maintenance too. A failed sensor that goes unnoticed creates false security, so the program has a running cost, not just a purchase price.
Why Construction Often Starts Cheaper
Here the "sensors are already there" point pays off. A fleet that leans on existing OEM telematics avoids the largest line item in the industrial version of this project, the sensor rollout. It spends instead on unifying and analyzing data it already generates.
Work Out Your Own Downtime Number
Published downtime-cost figures are guesses dressed as data. Your own number takes two minutes and is the only one worth budgeting against. For one machine class:
- Internal or external rental rate per day for that class.
- Day rate of the crew and support iron that stands idle when it stops.
- Cost of the schedule slip, if the machine is on the critical path.
- Add the three. Divide by working hours in a day. That is your cost per hour of unplanned downtime, for that class, on your jobs.
Run it for your three most critical classes. Those three numbers decide which machines deserve a sensor, in what order, and what you can spend. Headline ROI percentages in vendor material describe best-case deployments. Model your own.
How Do You Start an IoT Predictive Maintenance Program?
You start by taking stock of the data you already have, picking a small set of critical machines, and proving the alert-to-repair loop works before you scale. A big sensor rollout across the whole fleet is the fastest way to generate data nobody acts on.
The practitioner consensus is consistent. Get the data right first, start small, and treat the technology as something that supports your people rather than replaces their judgment.
Five Steps, In Order
- Audit what you already collect. List which machines have OEM telematics broadcasting usable data and which have a real gap. Buy hardware only for the gap.
- Start with your critical, failure-prone assets. The expensive machines whose downtime stops the job. Not the whole yard.
- Match the signal to the failure mode. Where you do add sensors, pick the type that detects the failures that happen on that asset.
- Validate before you trust. Run the system and check its alerts against reality. Tune thresholds to your machines and your duty cycles. Early false positives are calibration, not proof the system is junk.
- Close the loop, then expand. Confirm an alert reliably becomes a work order that gets completed. Only then add assets.
The Part That Decides Success
The deciding factor is rarely the sensors. It is whether the data lands somewhere that turns it into action. A program that pipes sensor readings into a dashboard separate from your maintenance system creates a data silo that impresses in a demo and changes nothing in the yard.
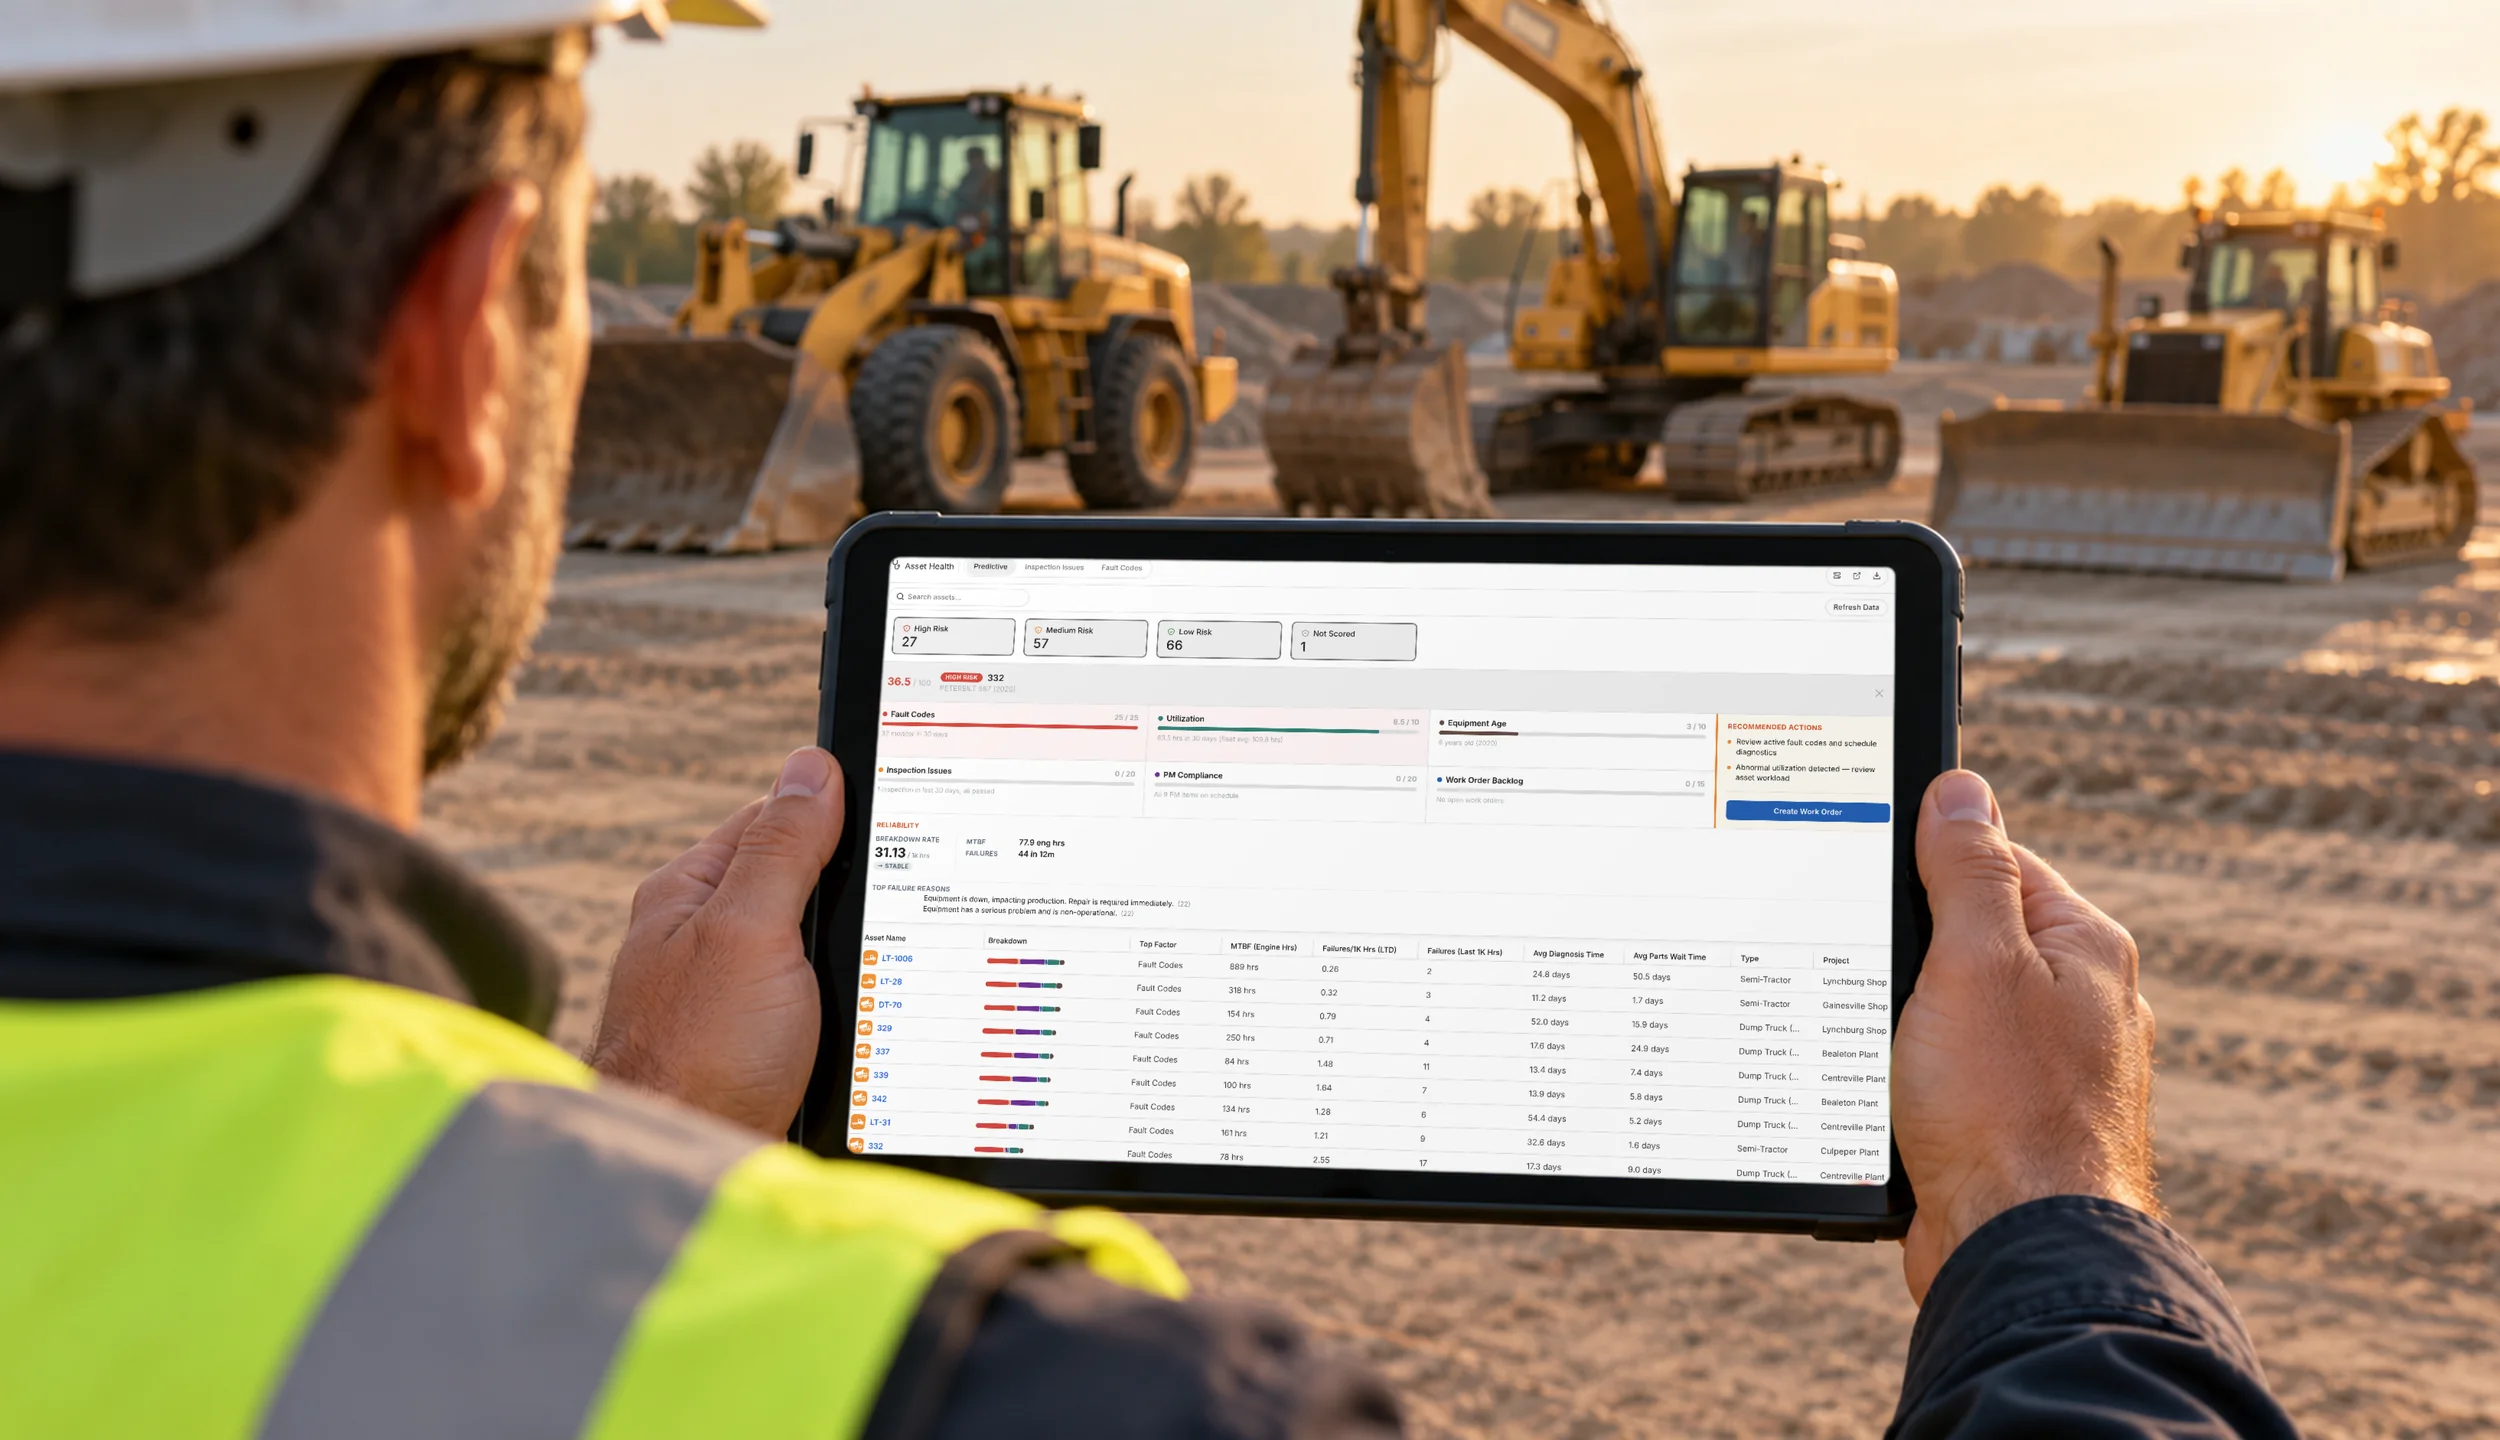
The programs that work route every signal into the system where work orders, inspections and history already live. What that looks like in practice is a predictive maintenance dashboard that ranks machines by risk instead of listing readings.
Should IoT Predictive Maintenance Live in Your Fleet System or a Separate Sensor Platform?
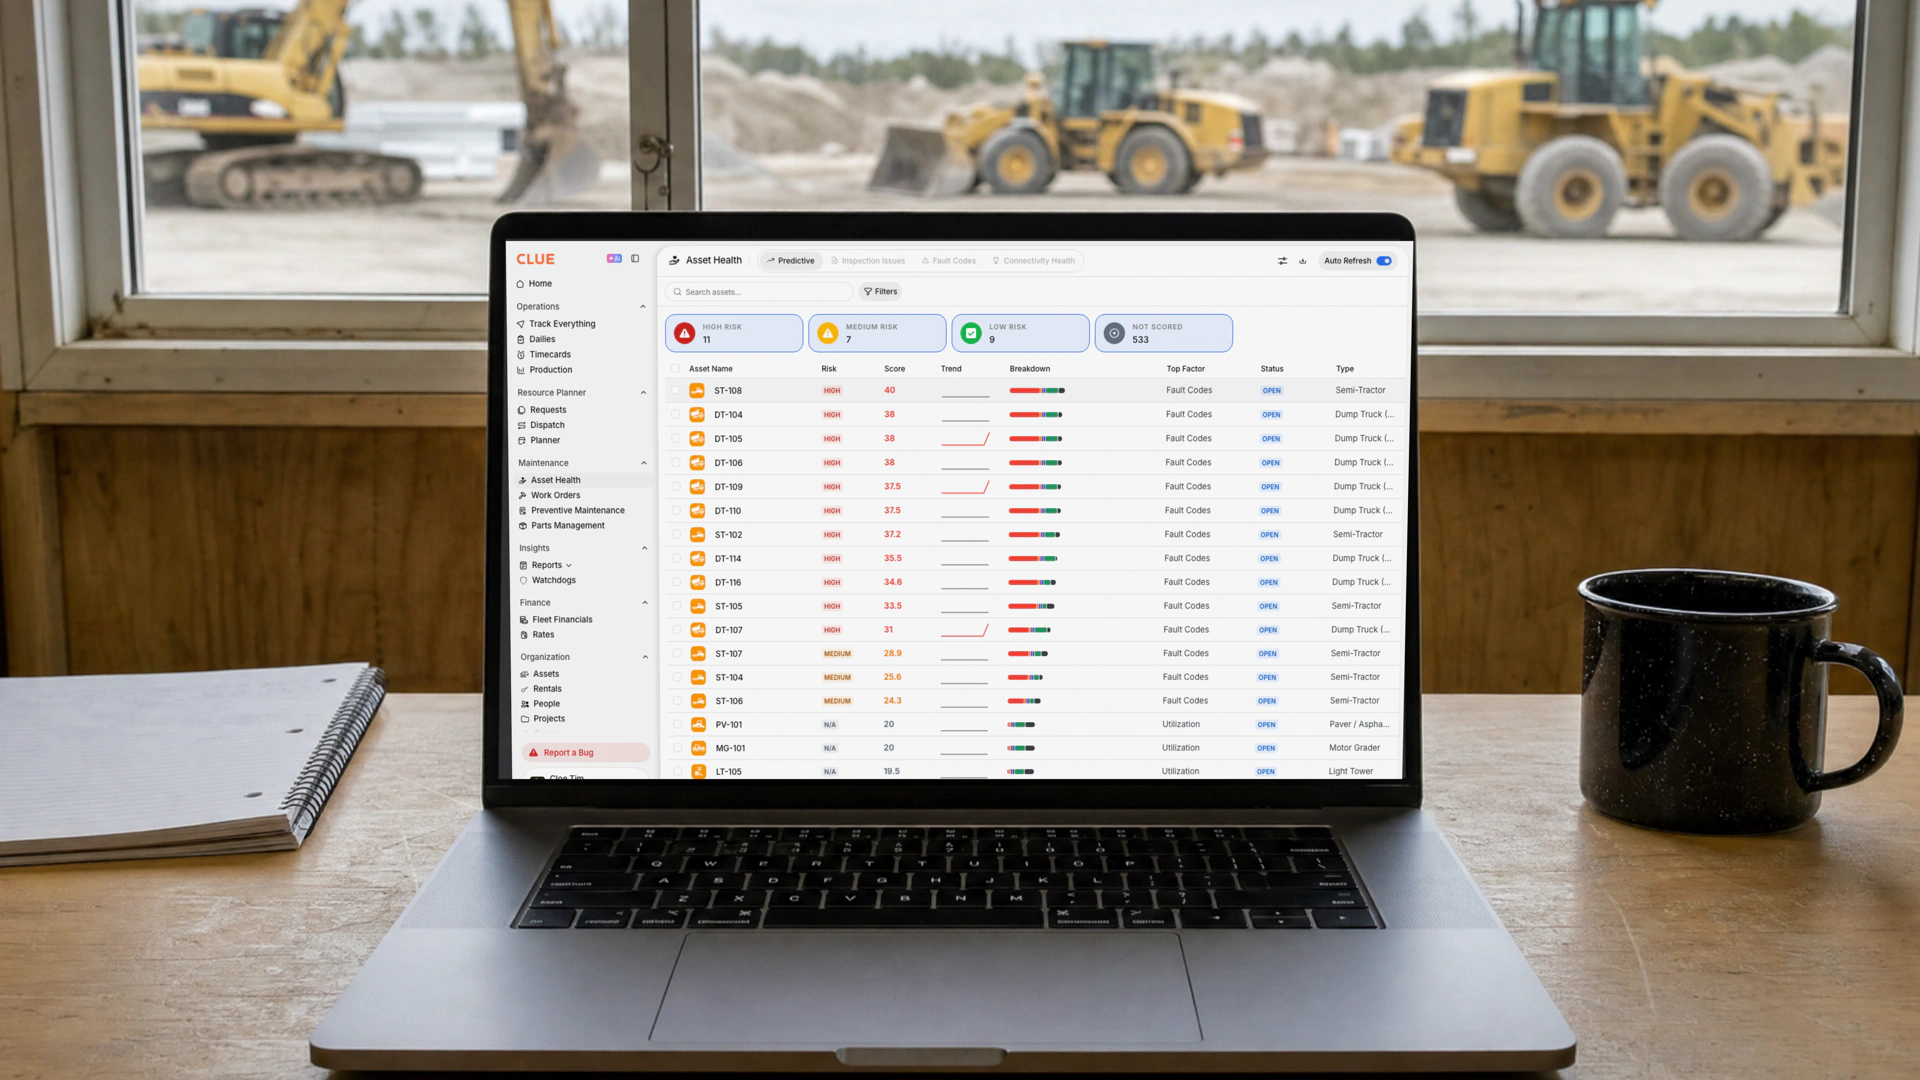
For most construction fleets, IoT predictive maintenance belongs inside the system that already runs your maintenance. The value is created when a condition signal becomes a completed repair, and that only happens where the work orders, inspections and equipment history already live.
A standalone sensor dashboard can produce beautiful condition data and still prevent zero failures, because the signal has nowhere to go.
Why Built-In Beats Bolt-On
A sensor signal is only useful when someone acts on it, in the right place, on the right machine. When the condition data and risk scoring live inside the fleet platform, a flagged risk becomes a work order in the queue your shop already works from. A failed inspection feeds the same loop. The alert-to-repair path is closed by default rather than bridged by hand.
A separate platform forces a handoff between the system that sees the problem and the system that fixes it. Handoffs are where programs leak. This is also where the multi-OEM reality decides things. A construction fleet needs one place that ingests Cat, Komatsu, Deere and Volvo data together, which a brand-specific portal cannot provide.
When Does One Machine Deserve Its Own Sensor Platform?
Built-in is not universal. If your need is deep, continuous, sensor-level analytics on a single critical asset, the kind of high-frequency vibration and acoustic modeling a process plant runs on one specific rotating machine, a dedicated specialist platform is the honest recommendation. A general fleet system would underserve it.
That case is real. It is also narrow, and it is not the one most construction fleets are in. For a mixed heavy-equipment fleet that needs the sensor data it already generates to turn into completed, costed repairs across the whole yard, the layer belongs inside the fleet system.
Clue brings telematics, predictive risk scoring, construction equipment work order software, construction equipment inspection software and equipment economics into one record per machine. Cat, Komatsu, Deere, Volvo, JCB, Hitachi, Bobcat and the rest of the yard land in the same place. The older iron that runs on an aftermarket box lands there too. If your equipment runs on hours, moves between job sites, and mixes brands and rentals, that is the fleet Clue was built for.
How Do You Choose an IoT Predictive Maintenance Approach for Your Fleet?

You choose by starting from the data you already have and the failures that actually hurt you. Then you test any vendor against the few things that decide whether sensor data prevents failures or just produces dashboards.
The decision is more reliable when you score it deliberately than when you react to a slick demo.
Six Checks Before You Buy
- Audit existing data first: Know what your OEM telematics already broadcasts before anyone sells you sensors, so you buy hardware only where there is a genuine gap.
- Match the solution to your failure modes: Confirm the sensors or data streams on the table detect the failures that occur on your machines.
- Demand cross-validation and a false-positive story: Ask how the system avoids false alarms and how technicians flag them. That decides whether your crew will trust it.
- Ask for the P-F interval: On your worst failure mode, how long is the gap between the first signal and the breakdown? A feature list is not an answer.
- Trace one alert end to end: Prove a condition signal becomes a work order someone closes, on your own data, not a reference slide.
- Confirm multi-OEM and mixed-fleet coverage: Make sure the system unifies every brand in your yard and carries the machines with no telematics, rather than one portal per manufacturer.
What Should You Do First?
IoT predictive maintenance earns its place when it gives your team enough warning to complete a repair before failure. Start with existing telematics. Add sensors where the data falls short. Connect validated alerts to assigned work orders.
Prove the approach on a few critical machines. Measure warning time, false alarms and repair completion. Expand when the results justify the cost.
Clue connects telematics, equipment history, inspections and work orders so your shop can review issues and track repairs in one system.
Frequently Asked Questions
What Is IoT Predictive Maintenance?
IoT predictive maintenance uses internet-connected sensors to monitor a machine's condition, vibration, temperature, pressure, oil and electrical signals, and analytics to forecast a failure before it happens. It differs from reactive maintenance, which fixes machines after they break, and preventive maintenance, which services them on a fixed schedule. The full comparison is in preventive vs predictive maintenance.
What Sensors Are Used in IoT Predictive Maintenance?
The main sensor types are vibration (the most widely used, for bearing wear and misalignment on rotating parts), oil analysis (often the earliest warning, detecting metal particles that signal internal wear), temperature, pressure (critical for hydraulics), acoustic and ultrasonic (for leaks and electrical faults), and current or power sensors (for electrical and load anomalies). Match the sensor to the failure mode that actually occurs on that asset.
Does Heavy Equipment Need Extra IoT Sensors?
Often not. Modern heavy equipment already reports engine and driveline faults as J1939 codes and streams machine status through OEM telematics such as Cat Product Link, KOMTRAX, JDLink and CareTrack. That is the IoT layer. ISO/TS 15143-3:2020 defines the fields you can request from any of them. For those machines, predictive maintenance is about reading data you already generate, not buying sensors. Aftermarket sensors still earn their place on older equipment with no telematics, on construction-specific needs like fuel-theft detection, and on deep single-asset monitoring.
Why Do IoT Predictive Maintenance Programs Fail?
The most common reason is false alarms. When a system cries wolf, technicians stop trusting it and ignore even the real alerts. Programs also fail when the wrong sensor is matched to an asset, when alerts never become work orders, and when sensor data sits in a dashboard separate from the maintenance system. Validating alerts across multiple signals and routing them into a real work order are what prevent this.
Can Sensor Data Predict Failures Before They Happen?
Yes, but only when the system does more than watch for a threshold. A basic sensor that alerts once a reading goes abnormal often gives you only days of warning, sometimes too late to schedule around a planned shutdown. Genuine prediction looks for the pattern that precedes the abnormal reading and combines live sensor data with the machine's maintenance history to forecast further ahead. Ask vendors how long the P-F interval is on your worst failure mode, not just whether they alert.
How Much Does IoT Predictive Maintenance Cost?
It depends mostly on whether you buy sensors or use existing telematics. Industrial wireless vibration sensors list from around $400 per point, a gateway is a separate line in the high hundreds, and a packaged multi-point system lists from around $2,200, plus a per-asset software subscription and integration time. A construction fleet leaning on existing OEM telematics avoids the largest cost, the sensor rollout. Judge the total against your own cost per hour of unplanned downtime, worked out on your own rental and crew rates.
What Is the Typical ROI on an IoT Predictive Maintenance Project?
There is no typical figure worth quoting. Published ROI percentages describe best-case deployments in plants, not mixed fleets on job sites. Build your own. Take your cost per hour of unplanned downtime for one machine class. Estimate the failures the program could catch in a year. Set that against sensors, subscription and your own integration time. Run it on three critical classes before you run it on a fleet.
How Does IoT Predictive Maintenance Reduce Operating Costs?
Through four lines on your P&L, in this order of size. Fewer unplanned failures, which means less emergency rental, less overtime and fewer idle crews. Repairs caught early, which cost less than the failure they prevent. Fewer unnecessary scheduled services, because the interval follows condition instead of the calendar. Lower parts inventory, because you stock for forecast failures instead of every possibility. The first line is usually worth more than the other three together.
How Do You Keep Telematics and Sensor Data Secure?
Four questions cover most of it. Who owns the data, you or the telematics provider. How is it transmitted and stored. Who inside your business can see location and operator data, and is that access by role. And what happens to the data if you leave. Get those in the contract. Location and operator data is personal data in several jurisdictions, so involve whoever handles that in your business before you switch a feed on.
Do IoT Gateways Work on a Remote Job Site?
Not always. This is the failure nobody demos. A plant gateway assumes mains power, a roof and steady network. A job site has none of those. Ask for the ingress rating, the operating temperature range, the power source, and what the device does when it loses signal for a week. A gateway that drops data instead of buffering it puts holes in the history your model needs.
Where Do You Buy IoT Predictive Maintenance for Heavy Machinery?
Three places, and they are not interchangeable. Your OEM dealer sells the telematics subscription for that brand. Sensor vendors sell add-on vibration, oil and pressure monitoring for specific assets. Fleet management platforms unify the brands and turn the result into work orders. A mixed fleet usually needs the first and the third. It needs the second only on a few critical machines.
Are There Case Studies for IoT Predictive Maintenance on Construction Fleets?
Most published case studies are manufacturing and plant, which is why they do not match a mixed fleet. When you read one, check three things: whether the equipment was fixed or mobile, whether the reported saving came from the sensor or from the process change around it, and whether the comparison is before-and-after on the same fleet or one group against another. Those three checks dismiss most of what is published.

Transform Your Equipment Management