A wheel loader’s transmission fails in the middle of a busy season. The shop quotes a major repair. The superintendent needs the loader back tomorrow. Finance asks why the fleet keeps pouring money into old iron. You, the equipment manager, have to decide by Friday.
A repair or replace call is a choice between paying for a fix and putting that money toward a rebuild, a replacement or a rental. Most of these calls happen one breakdown at a time. People use gut feel or a rule of thumb because a machine is down and a job is waiting. That can keep a machine past the point where each hour costs too much, or send a machine to market while it still has economical hours ahead.
The answer is usually in the repair history your team logs in construction equipment maintenance software. The challenge is putting that history beside the machine’s hours, value and work ahead.
This guide covers how to read a machine’s cost curve, compare repair, rebuild and replacement, and set a plan before the next failure.
Repair, Rebuild or Replace: Know Your Three Options
A repair fixes a failed part. A rebuild renews major systems. Replacement can mean buying new or used, or renting. Compare the options against the machine’s cost history and the work you need it to do.
| Option | What It Means | Best When | Main Risk |
|---|---|---|---|
| Repair | Fix the failed component and put the machine back to work. | The machine is still before its sweet spot. The frame and major systems are sound. | The next failure may be waiting behind this one. |
| Rebuild | Complete a planned major overhaul of the engine, powertrain or hydraulics to reset their wear. | The frame and structure are sound. The machine fits the work. The rebuild costs clearly less than replacement for the hours it buys. | Older technology and emissions systems stay. Other systems keep aging. |
| Replace | Sell or trade the machine and buy new or used, or rent. | Cost per hour is climbing, downtime is hurting jobs, or the machine no longer fits the work. | Capital outlay. A new machine has its own learning curve. |
The right answer depends on where the machine sits on its cost curve, which the next sections explain.
Why the 50% Rule Is Only a Starting Point
The 50% rule says to consider replacement when a single repair, or a year of repair bills, approaches 50% of the machine’s replacement cost or market value. It gives the team a clear point to stop and look at the choice. Treat it as an alarm bell, not a final answer.
A single quote cannot show whether costs have been rising for years or whether this is an unusual repair after a long stretch of steady work. The rule also leaves downtime and lost production out of the calculation.
Use is another gap. A lightly used loader and a machine that works through every shift can face the same quote, though the value of getting them back to work differs. The rule also says nothing about what the repair buys. A repair that adds many productive hours has a different value from one that gets the machine to its next failure. The 50% mark can start a review. It cannot tell you where that review should end.
Economic Life: Find Each Machine's Sweet Spot
A machine’s economic life is the point where its life-to-date cost per hour is at its lowest. In early years, owning cost per hour falls as engine hours build. The purchase price, less current resale value, gets spread across more hours. Repair and maintenance cost per hour tends to rise as parts wear and more systems need attention.
Add those costs together. Life-to-date cost per hour forms a U shape over the machine’s life. The low point is its economic life, often called its sweet spot. Before that point, added hours pull the average down. After it, each new hour costs more than the machine’s lowest life-to-date cost per hour.

Economic life is different from the date on an equipment depreciation schedule. Depreciation is an accounting estimate of value over time. It does not account for what the machine costs to keep working at its present hours or condition.
How to Calculate Life-to-Date Cost per Hour
Life-to-date cost per hour is the machine’s total owning, repair and maintenance cost divided by its engine hours.
Life-to-Date Cost per Hour = (Purchase Price − Current Market Value + All Repair and Maintenance Costs to Date) ÷ Engine Hours to Date
This formula gives an average from purchase to today. To spot a change sooner, track marginal cost per hour, the cost of the most recent block of hours, such as the last 2,000 hours or the last 12 months. When marginal cost per hour rises above the lowest life-to-date cost per hour the machine reached, it has passed its sweet spot.
Leave fuel and operator wages out if they cost roughly the same for an old or new machine of the same size. Include them when they differ in a meaningful way.
A 2004 Virginia Transportation Research Council report, The Replace Repair Decision for Heavy Equipment, studied repair cost data from the Virginia Department of Transportation fleet, an investment of about $500 million. Its authors, James S. Gillespie and Adam S. Hyde, recommended one extra statistic to spot replacement candidates: the ratio of a machine’s year-to-date labor and parts cost rate to its life-to-date rate.
Public fleets use the same kind of test. Gregory Speas, then fleet service director for the City of Hot Springs, Arkansas, told Government Fleet in 2009 that average cost per hour is his benchmark. When a unit runs above that average, “that’s when we start looking at it,” he said. Comparing marginal cost per hour with life-to-date cost per hour is one way to use asset lifecycle management to guide a decision.
How to Make the Repair or Replace Call in 6 Steps
Work through the same six steps for each machine so the team can compare the choices on a clear record:
- Pull the full cost history.
- Place the machine on its cost curve.
- Price what the repair buys.
- Price the alternatives.
- Weigh job fit and risk.
- Record the call.
1. Pull the Full Cost History
Pull the machine’s full cost history before you judge the current quote. Gather every work order with parts and labor, outside repair invoices, preventive maintenance costs, engine hours from telematics, purchase price and an honest current market value. The record needs to cover the machine’s full life, not only the work done in your shop.
Use work orders that close with consistent reason codes. A repeat reason code, such as operator error or lack of preventive maintenance, can show whether the same cause keeps returning.
2. Place the Machine on Its Cost Curve
Calculate life-to-date cost per hour and marginal cost per hour for the last 12 months or the last 2,000 hours.
Mark whether the machine is before, at or past its sweet spot. If you have enough history, compare more than one recent block of hours. That can help show whether a higher rate is a new change or part of a longer pattern.
3. Price What the Repair Buys
Read the shop quote for what the repair buys, not only for what it costs. Confirm the repair cost, expected downtime and the number of productive hours the repair should add before the next major failure.
A repair that buys years of work is not the same as one that buys months. The expected hours help you judge whether this repair gives the machine a useful bridge to its planned retirement, or leaves another large decision close behind.
4. Price the Alternatives
Price the alternatives next: the cost and expected service of a rebuild, a new machine, a used machine, or a rental for the rest of the season. Put each one beside the repair and use a shared time period for every option.
For rental costs and terms, use your rental management records. A side-by-side view gives operations and finance a way to compare the choices without relying on the purchase price alone. If you plan to buy, compare heavy equipment financing options on cost per operating hour too.
5. Weigh Job Fit and Risk
Weigh job fit and risk beside the cost curve, which is one part of the decision. Check how the machine fits its jobs and what could change if it is unavailable.
- Estimate downtime cost per day on the jobs it serves. Downtime tracking can help put the impact in the same terms as the repair quote.
- Check how often the machine works. A machine that sits most of the month may not need replacing and may be better sold. Review utilization alongside upcoming work.
- Confirm safety, emissions rules and technology the job now requires.
- Check parts availability and dealer support for an older model. A long wait for a needed part can affect how well it serves the fleet.
6. Record the Call
Record the call in writing: the decision, the numbers behind it and the reason the team chose that option. Add the expected work gained, the retirement date if there is one, and when you will review the choice again.
Tell the people who schedule and plan work if a machine is marked for replacement. Dispatchers should know if it is not meant to take a long assignment.
Worked Example: Repair or Replace a Wheel Loader
A worked example shows the repair or replace math on one wheel loader. All numbers below are illustrative and round, for a loader bought for $250,000, with fuel and operator costs excluded.
| Engine Hours | Estimated Market Value | Owning Cost to Date | Repair and Maintenance to Date | Life-to-Date Cost per Hour |
|---|---|---|---|---|
| 2,000 | $190,000 | $60,000 | $8,000 | $34.00 |
| 4,000 | $150,000 | $100,000 | $22,000 | $30.50 |
| 6,000 | $120,000 | $130,000 | $42,000 | $28.67 |
| 8,000 | $98,000 | $152,000 | $70,000 | $27.75 |
| 10,000 | $82,000 | $168,000 | $108,000 | $27.60 |
| 12,000 | $70,000 | $180,000 | $158,000 | $28.17 |
| 14,000 | $60,000 | $190,000 | $220,000 | $29.29 |
Life-to-date cost per hour bottoms out at about 10,000 hours, at $27.60.
Marginal Cost per Hour by 2,000-Hour Block
Marginal cost per hour is the cost of each 2,000-hour block on its own.
| Hours | Marginal Cost per Hour |
|---|---|
| 2,000 to 4,000 | $27.00 |
| 4,000 to 6,000 | $25.00 |
| 6,000 to 8,000 | $25.00 |
| 8,000 to 10,000 | $27.00 |
| 10,000 to 12,000 | $31.00 |
| 12,000 to 14,000 | $36.00 |
From 10,000 hours on, each new block costs more than the machine’s lowest life-to-date cost per hour of $27.60, so the loader is past its sweet spot.
The Call at 10,500 Hours
At 10,500 hours, the loader needs a transmission and the quote is $45,000. Before the sweet spot, this repair would likely be worth it.
Here, the quote goes on top of rising wear in other systems. The team compares it with a rebuild of the whole powertrain, a replacement, and renting through the busy season.
One reasonable call is to rent for the season, skip the transmission repair if a replacement can arrive in time, and order the replacement. If this machine is the only one that fits the work, repair it and set a firm retirement date. The same math on a machine at 6,000 hours would point the other way.
Set Replacement Thresholds Before the Next Breakdown
Make the repair or replace decision before a machine fails, not after. Set a target replacement point for each asset class using its own cost curves.
Review machines near their threshold every quarter. Put planned replacements into the capital budget a year ahead so finance can plan funds, operations can confirm what the work requires, and the shop can schedule the change. A target is a prompt to review, not a promise to sell on a fixed day. Condition, use and upcoming work can shift the timing.
Once a machine has a retirement date, continue preventive maintenance until that date. Scale other repair work to what keeps the machine safe and working through its remaining assignments.
Flag machines for safety-critical repairs only when that is the approved plan, so no team expects a full renewal for an asset already headed out.
Common Repair or Replace Mistakes

Repair or replace mistakes tend to happen under pressure, when a machine is down and a job is waiting. Even teams that track costs well can fall back on habit. These six mistakes push a fleet into keeping a machine too long or replacing the wrong one.
- Letting sunk cost decide: Money already spent, such as $30,000 on a recent repair, does not change what the next hour will cost.
- Using depreciation as the replacement schedule: Book value helps with accounting. Treating it as a sale date can leave the fleet without a decision based on the work the machine does.
- Replacing like for like: Before ordering the same size and type, check whether the fleet still needs that machine size or that many units.
- Leaving outside work out: Missing outside repair invoices and field repairs can make an older machine look cheaper than it is. See how much heavy equipment repair should cost when building the cost record.
- Making the call alone: Operations sees the job need. The shop sees machine condition. Finance sees the budget. Each brings a different cost into the decision.
- Selling too late: Resale value drops as hours climb and condition worsens. Waiting for the final breakdown can leave money on the table.
How Clue Helps You Decide When to Repair or Replace
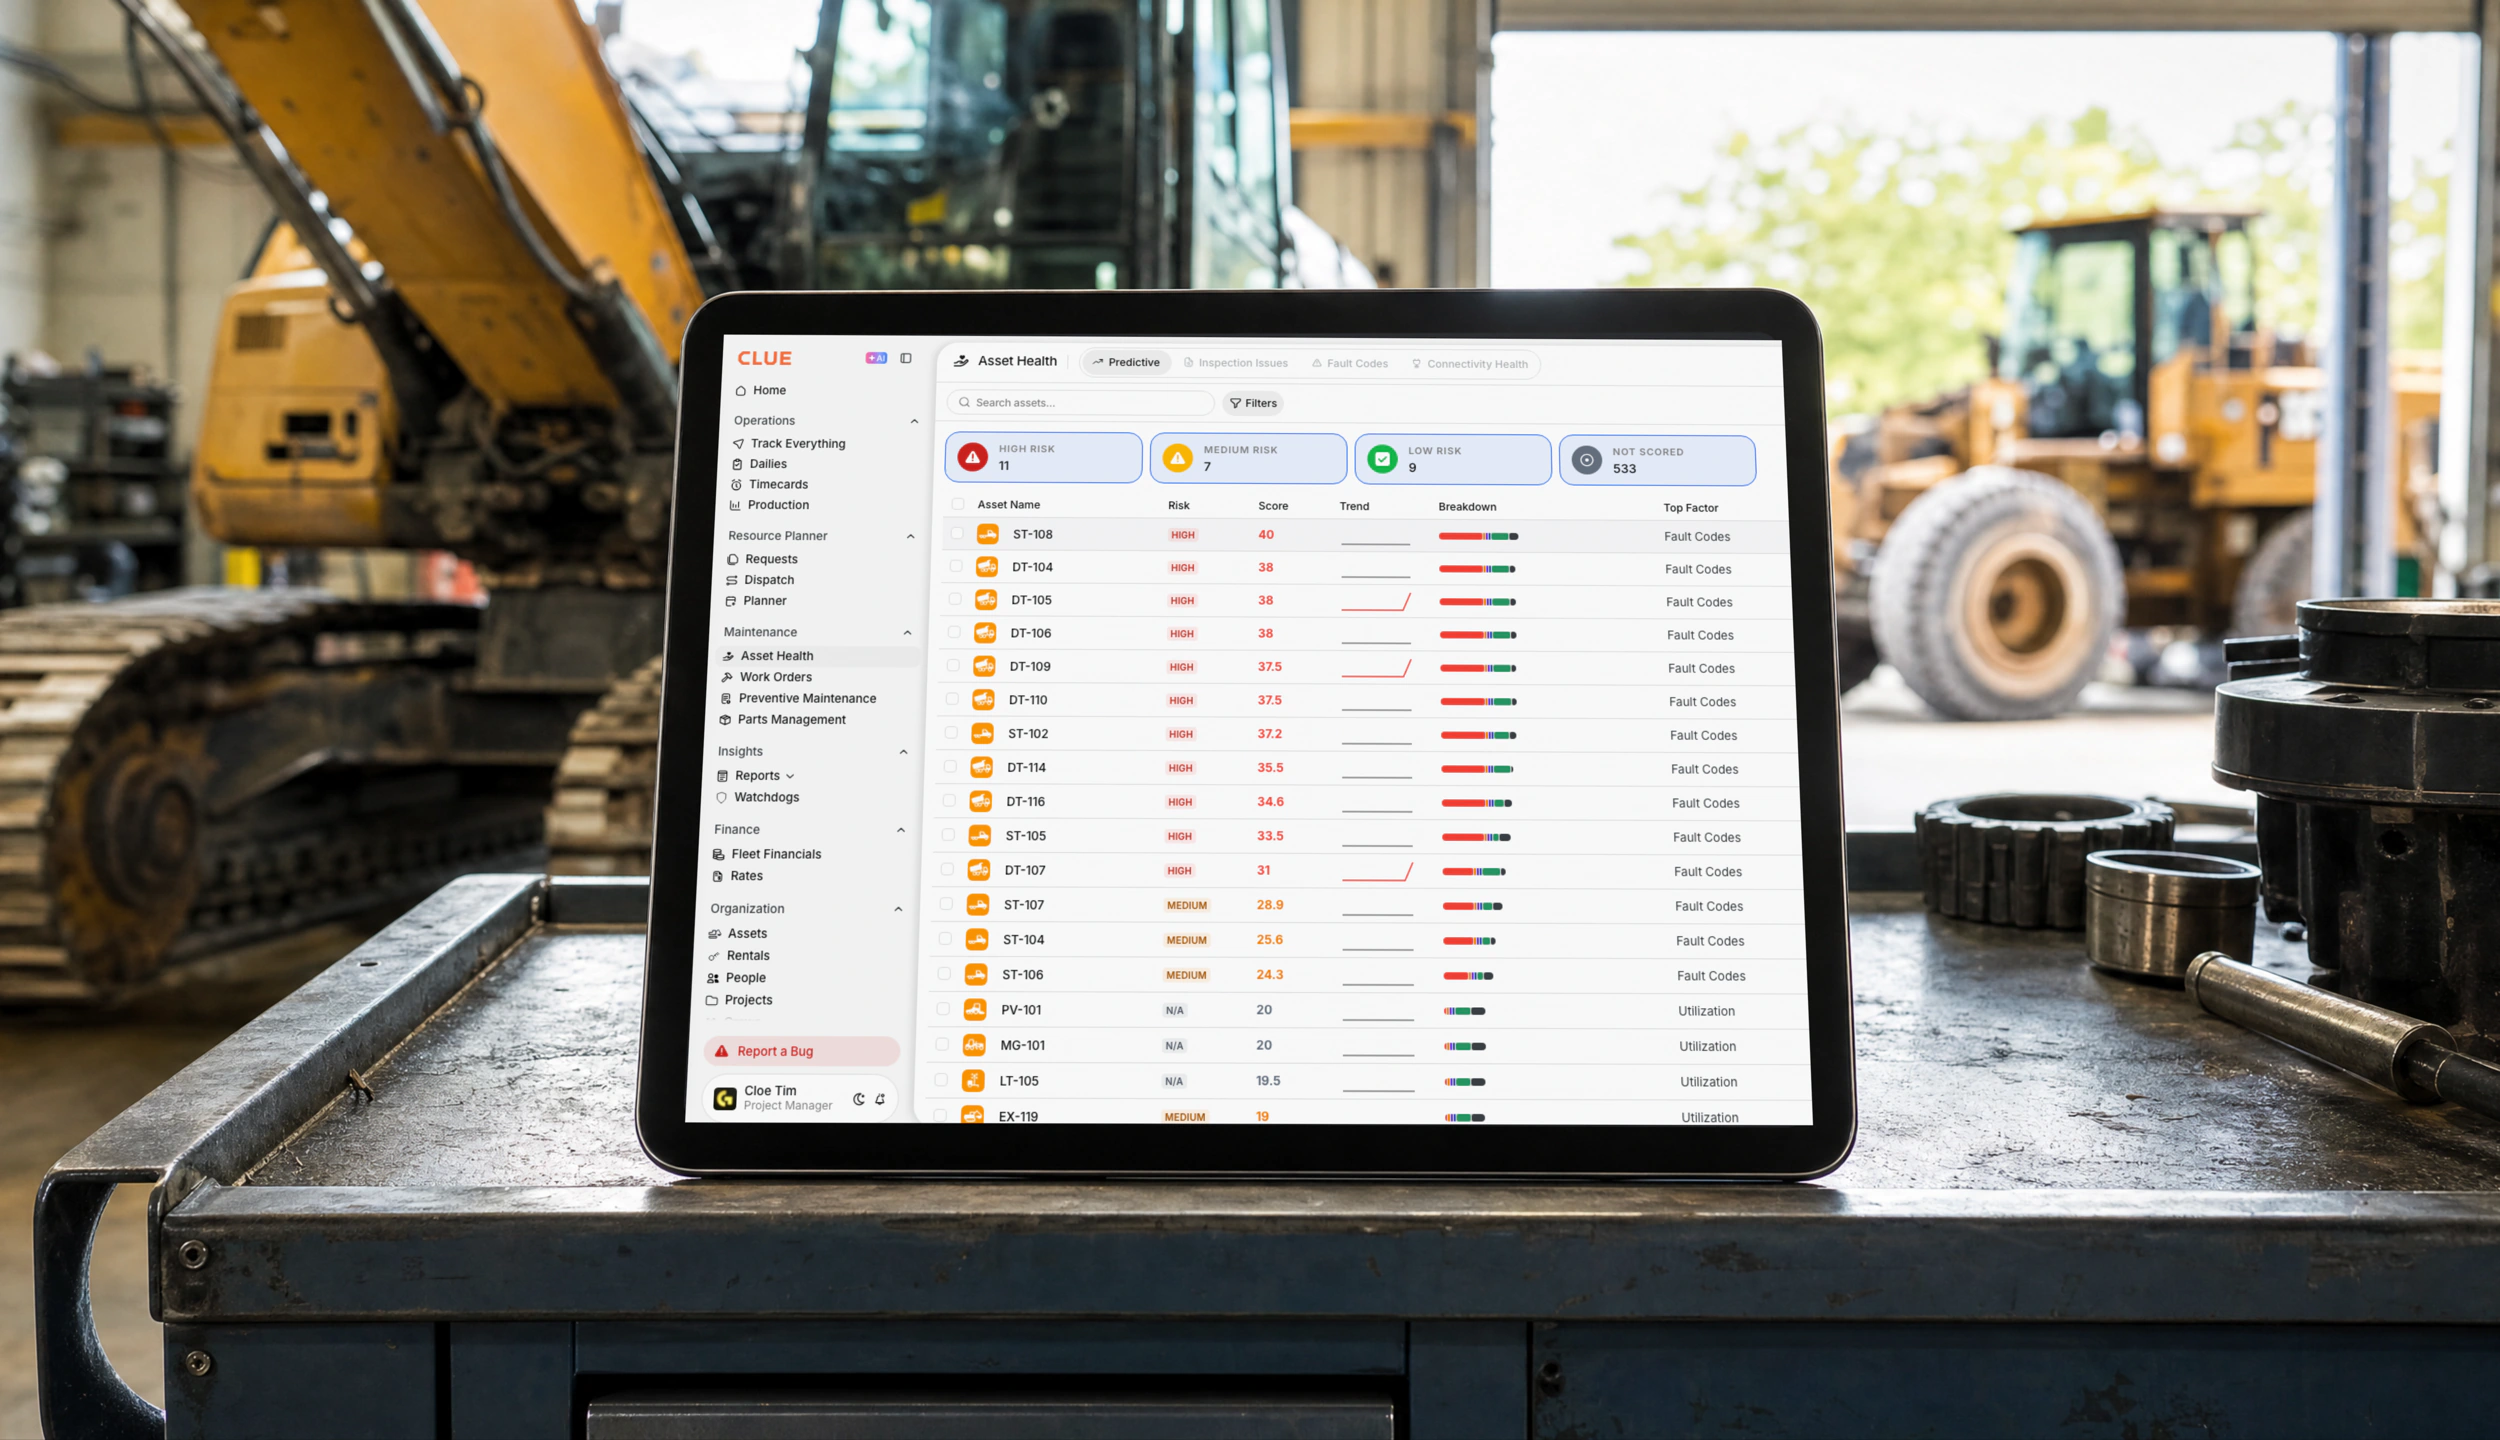
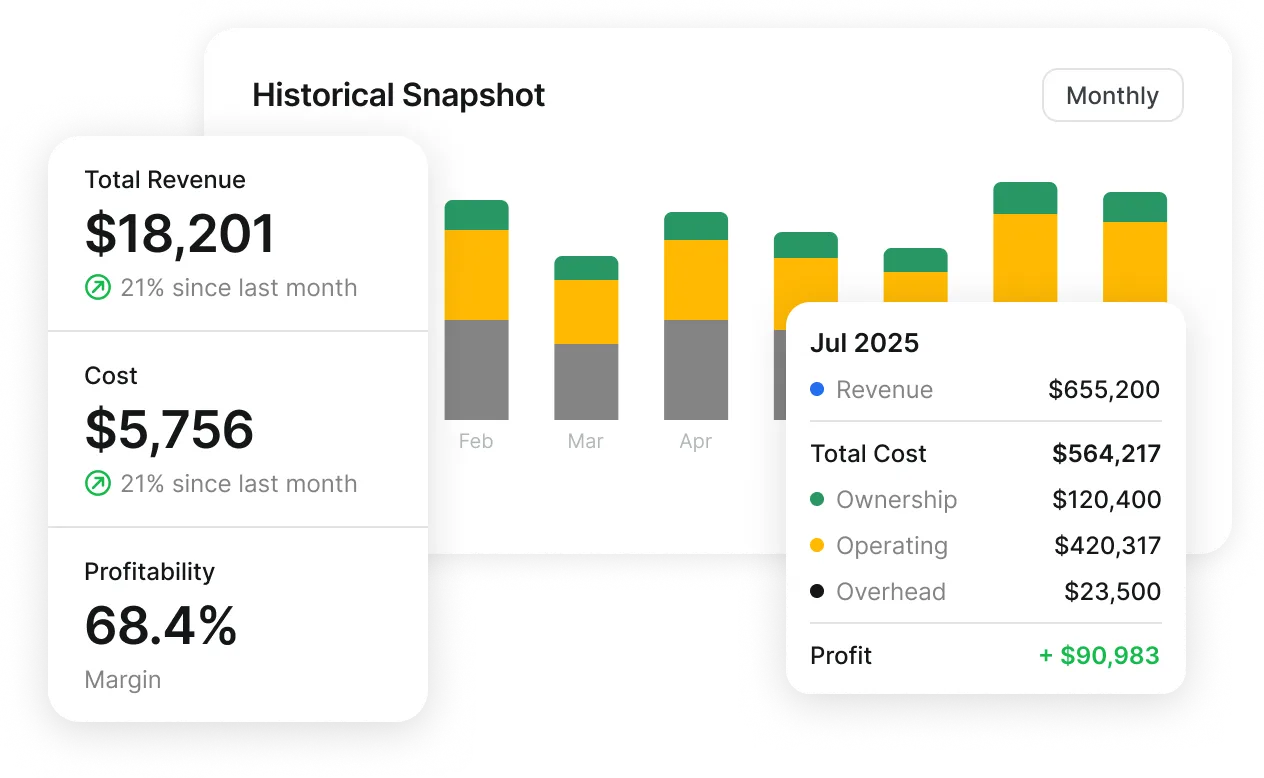
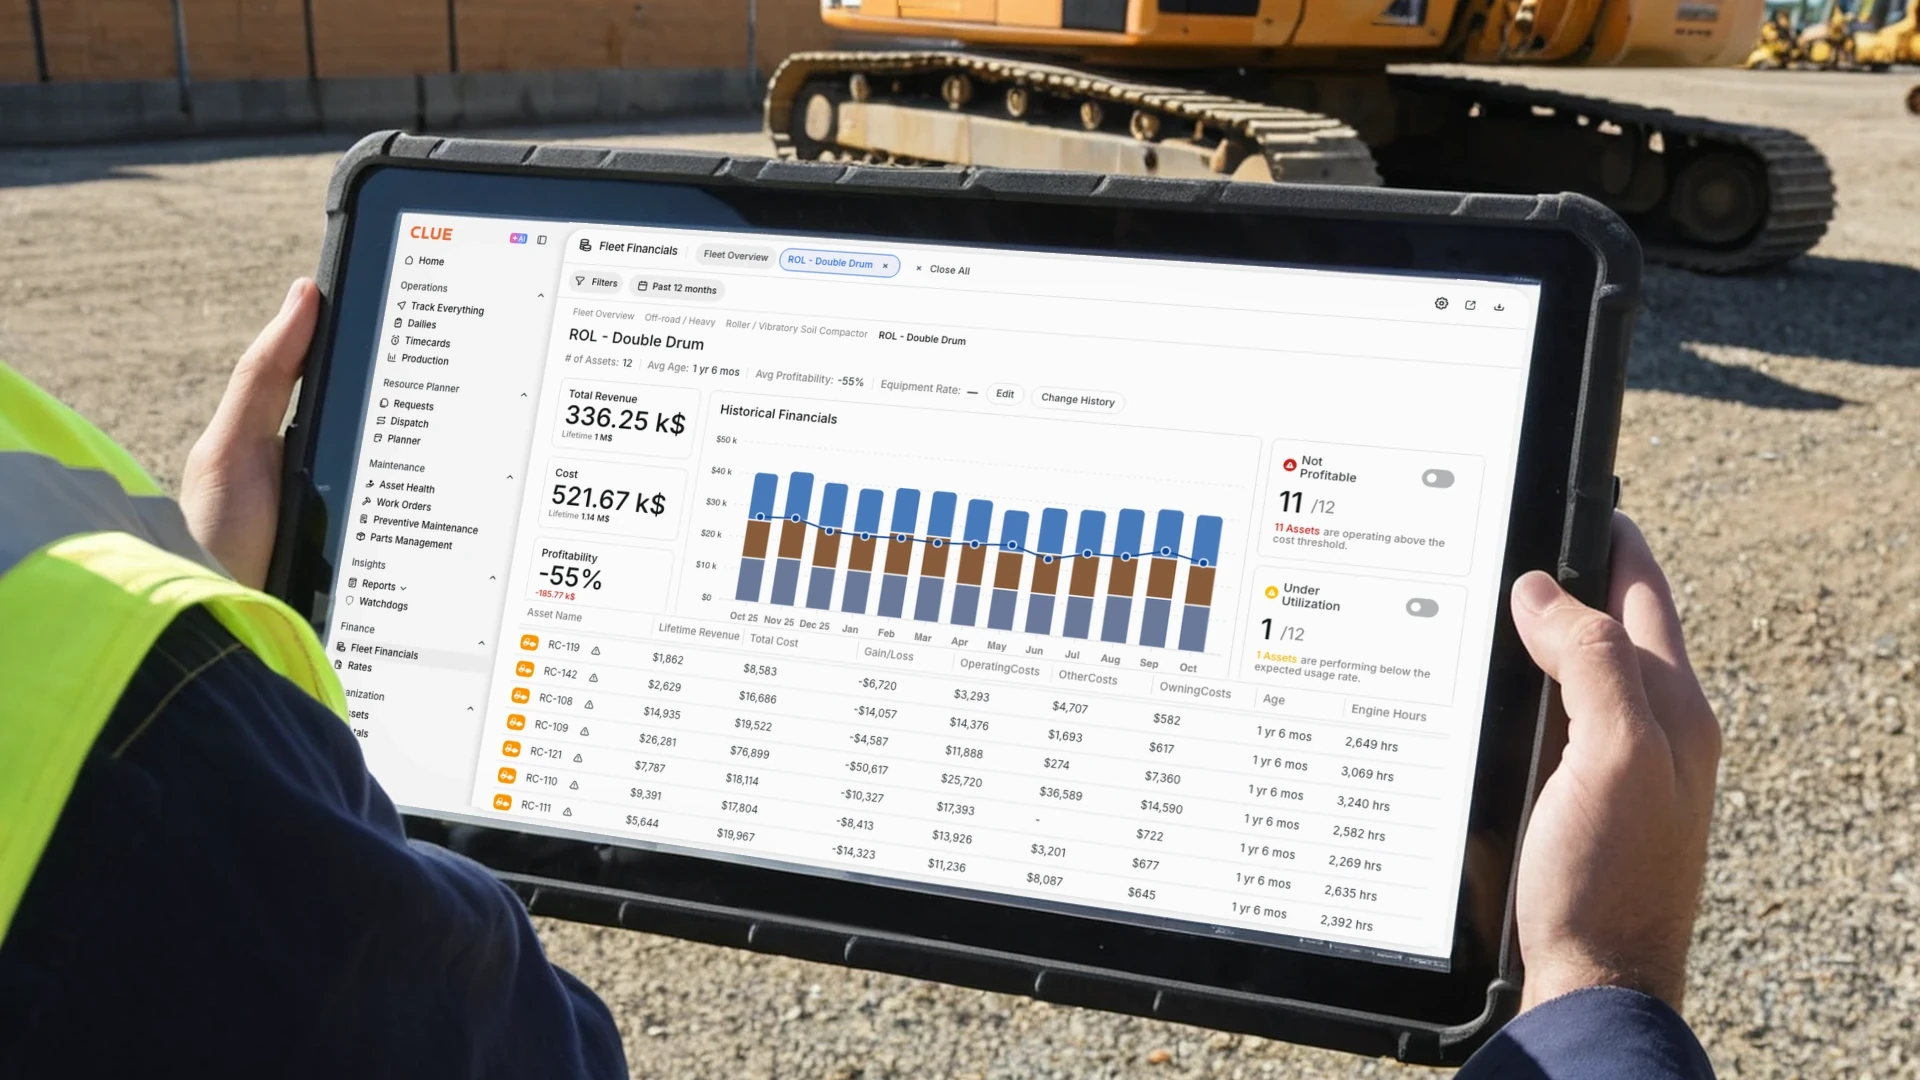
Clue is construction equipment management software that gives construction teams one place to manage equipment, maintenance, dispatch, rentals and fleet costs. It holds the cost and repair history a repair or replace decision needs and shows each machine’s sweet spot. Fleet Financials imports revenue, cost and depreciation data from your accounting system by CSV, so the analysis uses your actual figures. It shows revenue, total cost and profitability by division, product class and asset. It also flags assets that are not profitable or are underutilized. See equipment management reports and analytics.
At the asset level, the analysis shows purchase price, engine hours, salvage value, and a life-to-date cost per hour chart with owning and operating cost lines. Monthly cost breakdowns include labor and outside repairs. Sweet spot analysis shows cost per hour and engine hours at the point where repair costs begin to overtake the value of keeping the machine.
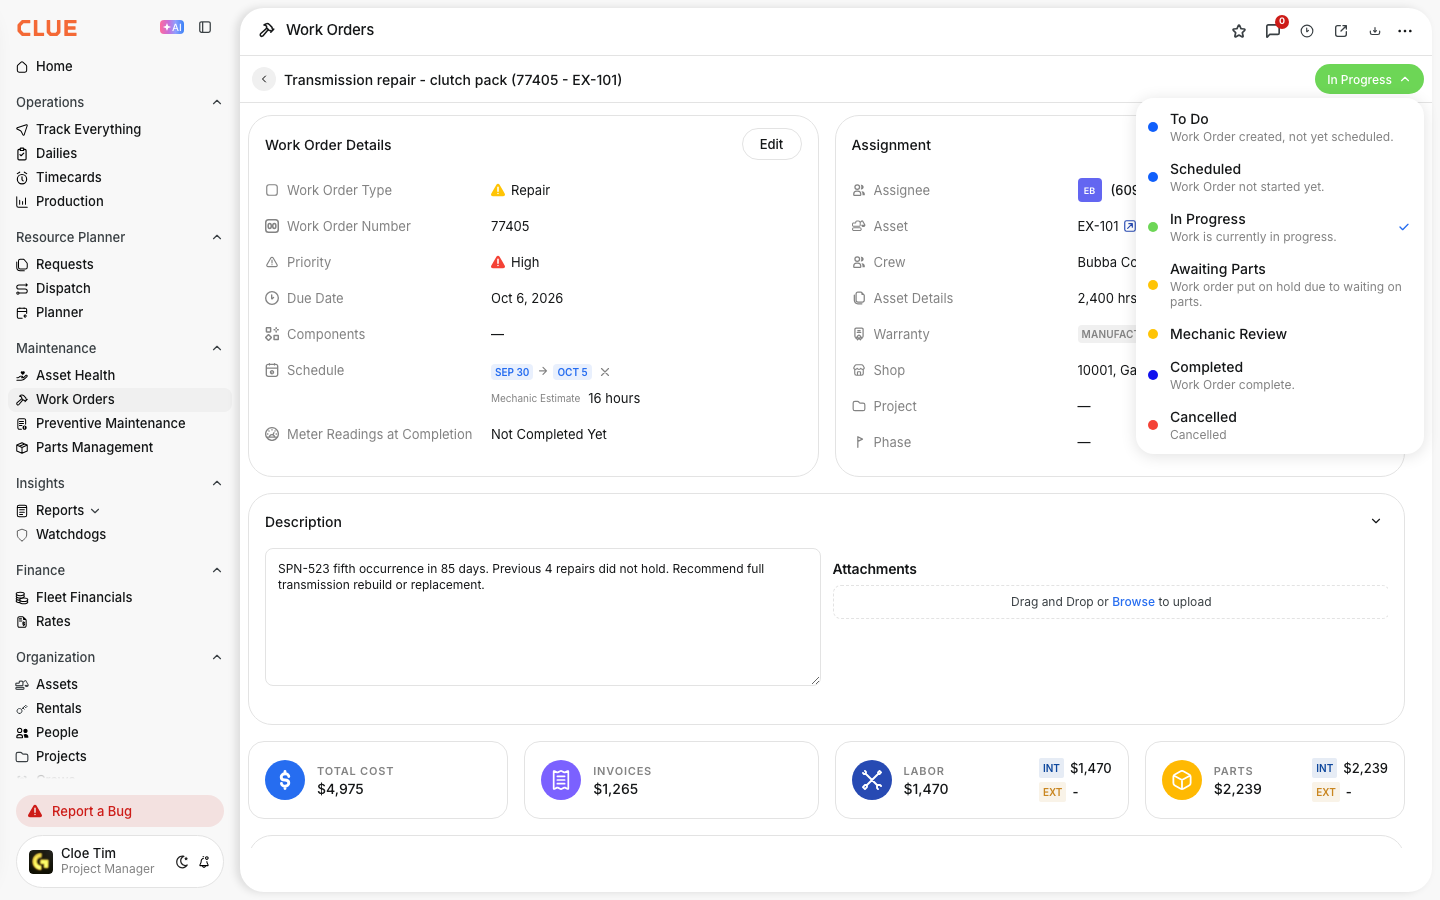
Work orders capture parts and labor costs for each repair. When an administrator sets up a predefined list, mechanics pick a reason code as they close a work order, such as Normal Wear, Operator Error or Lack of Preventive Maintenance, so repeat causes show up in reports.
The Replace Asset and Repair Asset toggles are independent. The team can plan a replacement and keep repairing the machine, or stop repairs while the replacement is on its way. A machine marked for replacement shows as “Replacement planned,” so dispatchers and planners can see it. Clue shows the numbers behind the choice. Your team makes the decision.
Repair or Replace: Decide Before the Breakdown

The repair or replace call on the wheel loader from the opening is still hard during a busy week. Its cost curve gives the team a way to put the transmission quote beside what the machine has cost and what it can do next.
This week, pick the five oldest machines by engine hours. Calculate life-to-date cost per hour and marginal cost per hour for the last 12 months for each. Mark any machine where the marginal cost is above its lowest life-to-date cost per hour. Those are the machines to decide on before they break, not after.
If Clue is on your shortlist, book a demo and bring the machine you are trying to decide on.
Heavy Equipment Repair or Replace FAQs
Heavy equipment repair or replace questions tend to come up when a big repair quote lands. These short answers cover the 50% rule, economic life, rebuilds, rentals and review timing. Each one is short enough for equipment managers and finance teams to use in a meeting.
When Should You Replace Heavy Equipment Instead of Repairing It?
Replace heavy equipment when its marginal cost per hour stays above its lowest life-to-date cost per hour, when downtime is hurting the jobs it serves, or when it no longer fits the work. Repair it when it is still before its sweet spot and the frame and major systems are sound.
What Is the 50% Rule for Equipment Repair?
The 50% rule is a prompt to consider replacement when a repair or a year’s repair bills approach 50% of replacement cost or market value. Use it to flag a machine for review. It does not account for the job it serves or the work a repair may add.
What Is the Economic Life of Heavy Equipment?
The economic life of heavy equipment, often called its sweet spot, is the point where a machine’s life-to-date cost per hour reaches its lowest level. It reflects owning and repair costs across the hours the machine has worked. Its place on an accounting schedule may differ from this cost-based point.
How Do You Calculate When to Replace Heavy Equipment?
Calculate life-to-date cost per hour: purchase price minus current market value, plus all repair and maintenance costs to date, divided by engine hours to date. Then calculate marginal cost per hour for the last 2,000 hours or 12 months. When the marginal cost stays above the lowest life-to-date cost per hour, the machine is a replacement candidate.
Is It Better to Rebuild or Buy New Heavy Equipment?
A rebuild can make sense when the machine’s structure is sound, it still fits the work, and the overhaul buys enough hours at a lower cost than replacement. Buying new or used may fit better when the machine’s systems or required technology no longer suit the jobs ahead.
Should You Keep Repairing a Fully Depreciated Machine?
Yes, if the machine still serves the work and its cost per hour supports keeping it. A zero book value does not mean the machine has no operating value. Compare its current costs and condition with the cost of another way to cover the same work.
Is Renting Cheaper Than Replacing a Machine?
Renting can cost less when you need a machine for a short period or while a replacement is being arranged. Compare rental terms and the work period with replacement cost, expected use and the timing of delivery. The right option depends on how long you need the machine.
How Often Should You Review Replacement Decisions?
Review machines near their replacement thresholds every quarter. Review sooner when a major repair, a change in job needs or a shift in machine use may affect the plan. Put planned replacements into the capital budget a year ahead so finance can plan the funds.
What Are the Signs That Heavy Equipment Needs Replacing?
The main signs are a marginal cost per hour above the machine’s lowest life-to-date cost per hour, repeat failures, less time between failures and more downtime. Hard-to-find parts, new safety or emissions rules and low use also count. Check these patterns with costs and job needs. Equipment reliability metrics can help you track changes over time.

Transform Your Equipment Management