A hydraulic hose bursts on an excavator in the middle of a trench job. The crew waits while the shop sends a truck. It is the third hose failure on that machine class this year. Each time, a mechanic replaces the hose and closes the work order.
The repair gets the machine moving. It does not show why the hose keeps failing, what each breakdown costs the job, or how to catch the next one sooner. Fixing repeat failures one at a time can hide a pattern. Teams need a shared way to review failures and choose what to change.
Fleets that log repairs in construction equipment management software already have many of the records an FMEA needs. This guide shows how to run one for a construction fleet, rank risk, and turn the results into maintenance actions.
What Is Failure Mode and Effects Analysis (FMEA)?
Failure mode and effects analysis (FMEA) is a structured review of possible failures, their effects, and ways to reduce risk.

The method has a long record. The U.S. military formalized it in 1949 as MIL-P-1629, and NASA used it during the Apollo program, where a missed failure could cost lives. Three documents define it today: IEC 60812:2018, the international standard for FMEA, SAE J1739, updated in 2021, and the AIAG & VDA FMEA Handbook, published in 2019 for the automotive industry.
Design FMEA helps engineers assess a product they are designing. Process FMEA helps teams assess a manufacturing or work process. Equipment or maintenance FMEA helps teams assess machines in service and the work that supports them. This guide covers that third type. It is a practical part of asset performance management.
FMEA Terms at a Glance
| FMEA Term or Element | Plain Language Meaning | Construction Equipment Example |
|---|---|---|
| Item and Function | How parts serve a need | Hydraulic pump moves oil |
| Failure Mode Description | How the item can fail | Hydraulic hose ruptures |
| Effect of Failure | What follows after failure | Machine down, oil spill, crew idle |
| Possible Failure Cause | What may lead to failure | Hose rubs on frame |
| Current Control Measures | Steps to prevent or find failure | Daily machine walkaround |
| Severity Rating (S) | How serious the effect is | A leak stops work |
| Occurrence Rating (O) | How often the failure happens | Repeat hose repairs in this class |
| Detection Rating (D) | How hard it is to catch early | No warning before the hose bursts |
| Risk Priority Number (RPN) | Severity times occurrence times detection | 7 × 6 × 5 equals 210 |
| Recommended Next Action | What the team will change | Add a clamp and hose check |
How to Run an FMEA on Construction Equipment in 8 Steps

Run the review with clear boundaries and a shared scoring scale. Focus on failures your team can prevent, detect, or respond to.
1. Pick One Asset Class
Start by choosing the asset class with the most breakdowns or the highest downtime cost. Compare mean time between failures, downtime cost per hour, and time out of service across classes.
Use these measures to see where downtime weighs most on your work. Keep the review to one class. A class with frequent downtime gives your team a clear place to start, while one class keeps the scope useful.
2. Build a Small Team
Bring together people who maintain and operate the machines. Include an equipment manager, shop manager, lead mechanic, experienced operator, and safety staff.
Use crew roles, shift patterns, tailgate meeting notes, and recent job risk reviews to decide who needs a seat. Their views can put job conditions and repair needs in the same discussion. This mix brings maintenance and operation into one review.
3. Break the Machine into Systems
Break the machine into systems and state what each system does. Use machine diagrams, parts catalogs, operator handbooks, and equipment function charts to map each system's function. Include:
- Engine and cooling
- Hydraulics
- Undercarriage or tires
- Powertrain and final drives
- Electrical and electronics
- Aftertreatment
- Brakes and steering
- Structure
- Attachments
For each system, state its job, such as carrying engine heat away. A clear function makes it easier to name a failure.
4. List Failure Modes
For each function, name the failure in clear terms. Examples include a ruptured hose, loose track bolt, or overheated engine. Then review work orders, repeat diagnostic trouble codes, failed inspection items, service bulletins, operator reports, and DVIR records.
Equipment maintenance software can keep these records together. Use the records to find repeat failures a quick discussion may miss when you list each failure mode.
5. Describe Effects and Causes
Describe what each failure changes for the machine, the job, safety, and cost. List likely causes such as wear, contamination, missed PMs, or site conditions. Before choosing causes, check repair photos, removed parts, fluid sample results, and site condition notes.
Use that evidence to support your cause list. A part replacement alone does not show what changes for the crew or job.
6. Record Current Controls
List the controls already used to prevent or catch each failure. Include PMs, walkarounds, fault alerts, fluid analysis, and operator training.
Check PM plans, alert settings, training sign-offs, and fluid analysis schedules to see which controls are in place and whether they are complete. If no control exists, record "nothing, we find it when it breaks." Use that gap to guide an action in a preventive maintenance plan.
7. Score Severity, Occurrence, and Detection
Agree on scoring scales before you rate the failure modes. Use the agreed definitions to rate severity, occurrence, and detection for each line.
Look at job impact statements, failure count ranges for the class, and the time between an early sign and lost work when you choose scores. Record why the team chose each score. Ratings can look exact even when they are not, so keep the reason with each score.
8. Assign Actions, Owners, and Dates: Put the Review to Work
Give each high priority line an action, an owner, and a due date. Track actions in the FMEA log, parts requests, and shift handoff notes. After an action has been in place, re-score occurrence and detection for that line.
Confirm each action is in use. Check that it helps prevent or detect the failure. Keep completion dates with the action record.

Severity, Occurrence, and Detection Scales for Equipment Fleets
These example scales give your team a place to start. Adapt them to your equipment and work. Agree on what each score means before reviewing failure lines.
Severity Scale
| Score From This Range | Meaning for This Score | Construction Equipment Example |
|---|---|---|
| 1 to 2 | Minor effect, no downtime | Cab rattle needs no shift repair |
| 3 to 4 | Small repair or delay | Loose panel fixed at next service |
| 5 to 6 | Downtime or job delay | Failed sensor stops work until replaced |
| 7 to 8 | Major damage or long repair | Final drive failure takes machine out of service |
| 9 to 10 | Safety hazard or major destruction | Structural failure may injure someone or destroy equipment |
Occurrence Scale
| Score From This Range | Meaning for This Score | Construction Equipment Example |
|---|---|---|
| 1 to 2 | Rare in this class | Not seen in this class in years |
| 3 to 4 | Infrequent in the class | Seen in isolated repairs |
| 5 to 6 | Recurring across the class | Happens a few times yearly across class |
| 7 to 8 | Common across the class | Affects most machines each season |
| 9 to 10 | Repeated across the class | Every machine has it repeatedly |
Use your fleet's history to define each band. Do not turn these descriptions into failure rates without enough records. Compare lines within your fleet, not patterns across all fleets.
Detection Scale
| Score From This Range | Meaning for This Score | Construction Equipment Example |
|---|---|---|
| 1 to 2 | Easy to catch well before failure | Fault code or sensor gives early warning |
| 3 to 4 | Likely to be found in routine checks | Daily check catches loose hose clamp |
| 5 to 6 | Usually found at a planned check | Service or fluid analysis finds wear |
| 7 to 8 | Hard to catch before the effect grows | Weak symptom appears only on close inspection |
| 9 to 10 | No clear warning before failure | Found only when machine stops |
A high detection score means the warning is hard to see early. A low score means the signal is clear and likely to be found before the effect grows.
RPN vs Action Priority: How to Rank the Risks
Risk Priority Number (RPN) = Severity × Occurrence × Detection
With 1 to 10 scales, RPN ranges from 1 to 1,000. It sorts a list. It does not decide which risk matters most.
A frequent, easy-to-fix nuisance can get the same RPN as a rare failure that can hurt someone. The formula gives each score equal weight, even when effects differ.
Use these rules to rank the work:
- Any severity score of 9 or 10 gets an action, no matter its RPN.
- Rank the remaining lines by severity and occurrence together.
- Use RPN to sort lines within a group with similar severity and occurrence.
The automotive industry reached the same conclusion. The AIAG & VDA FMEA Handbook (2019) replaced RPN with Action Priority tables that give severity more weight, and SAE J1739 adopted the same approach in its 2021 update. A fleet FMEA can borrow that rule without adopting the full seven-step automotive method.
When two lines tie, compare downtime cost per hour for that class. Your downtime tracking can show which line has the greater effect on the work.
Worked Example: FMEA for a Hydraulic Excavator
Every score below is illustrative. Use your fleet's agreed scales to score an actual machine class.
| System | Failure Mode | Effect | Cause | Current Control | S | O | D | RPN |
|---|---|---|---|---|---|---|---|---|
| Hydraulics | Hose ruptures | Machine down, oil spill, crew idle | Hose rubbing on frame, no clamp | Daily walkaround | 7 | 6 | 5 | 210 |
| Engine and cooling | Engine overheats | Derate or engine damage | Radiator plugged with debris | Fault code alert | 8 | 5 | 3 | 120 |
| Aftertreatment | DEF/SCR fault forces derate | Machine slows or shuts down | Contaminated DEF, sensor fault | Fault code alert | 6 | 5 | 3 | 90 |
| Undercarriage | Track shoe bolts loosen | Track damage, unplanned stop | Bolts not re-torqued after service | Found at failure | 6 | 4 | 8 | 192 |
| Powertrain | Final drive seal leaks | Gear damage, long repair | Seal wear, debris wrapped around drive | 500-hour service check | 8 | 3 | 6 | 144 |
| Swing system | Swing bearing wears | Play in upper structure, costly repair | Missed greasing intervals | Grease log | 9 | 2 | 6 | 108 |
Each RPN is severity multiplied by occurrence and detection. The team also weighs the effects:
- The swing bearing gets attention first because its severity is 9, even though its RPN is lower than the other high-severity lines.
- The hose line has the top RPN. Check hose routing, add clamps, and add a hose check to the inspection list.
- Add a torque check to the PM task list. It can help catch looseness before track damage.
- An overheating fault code can trigger a work order for review.
The example shows how a clear cause can point to a practical change. The action should fit the way the failure appears and the work the crew can do.
A Simple FMEA Template for Your Fleet
Use these columns to capture each failure, score, and next step in one fleet sheet.
| Column | What to Enter |
|---|---|
| Asset Class | The machine group included in the review |
| System | The machine area being reviewed |
| Function | What the system must do |
| Failure Mode | How the function can fail |
| Effect | What follows for the machine, crew, or job |
| Cause | The condition that may lead to the failure |
| Current Control | The steps in place to prevent or find it |
| S | Severity score |
| O | Occurrence score |
| D | Detection score |
| RPN | The product of S, O, and D |
| Action, Owner and Due Date | The planned change, person responsible, and target date |
Add a re-score column after the review to show whether the action changed the scores.
Turn FMEA Results Into Maintenance Actions
| Recommended Maintenance Action Type | When This Action Fits Best | Example Action for Construction Fleets |
|---|---|---|
| Change a PM Interval or Task | A routine check or service can prevent failure | Add a hose rub check to service |
| Add an Inspection Checklist Item | Someone can spot a visible warning | Check clamps and hose routing |
| Set a Fault Code Alert or Automatic Work Order | A fault code gives a useful warning | Create a work order for an overheating code |
| Add Fluid Analysis or Condition Monitoring | A sample or sensor can show a change | Check oil for signs of wear |
| Stock Critical Spare Parts | A part is needed to restore the machine | Keep a common hose and fitting ready |
| Train Operators on Failure Warnings | Operator practice affects the cause or warning | Show what a hot engine warning means |
| Work With the Dealer on a Fix or Retrofit | A machine change may reduce repeat failure | Ask about a better hose guard |
| Plan to Replace the Asset | Risk and repair needs keep rising | Plan replacement when repairs no longer fit |
Match each action to how the failure appears. Use inspections for visible signs, work orders to track repair tasks, and condition monitoring when a sample or sensor can show a change.
Common FMEA Mistakes Equipment Teams Make

- Combining the Failure Mode and Cause: A hose rupture is what failed. Rubbing on the frame may be what led to it. Keeping these separate makes it easier to choose a fitting action.
- Scoring Detection Based on a Planned Control: Score the checks and alerts that exist now. A planned action belongs in the recommendation, not in the current score.
- Using One Line for Different Machine Models: Similar machines may have different failure patterns. A combined line can blur which model, system, or condition is tied to the issue.
- Holding Marathon Sessions: Trying to finish the whole review in a day can rush the discussion. Short sessions by system give the team room to check details between meetings.
- Leaving Out Operator-Caused Failures: A failure can involve operator actions even when training is available. Describe the action and conditions so the team can consider guidance, visibility, or machine setup.
- Closing the FMEA When the Spreadsheet Is Done: The sheet can lose value when work conditions or repair experience change. Treat it as a working document, using the guide to causes of equipment failure to review possible causes.
How Clue Supports FMEA for Construction Equipment
Clue holds the records an FMEA is built from. The Asset Reliability Report calculates mean time between failures by asset class and shows the fault codes that come up most often.
You can group the report by region, project, asset category, asset type, product class, make, or individual asset. You can export the data.
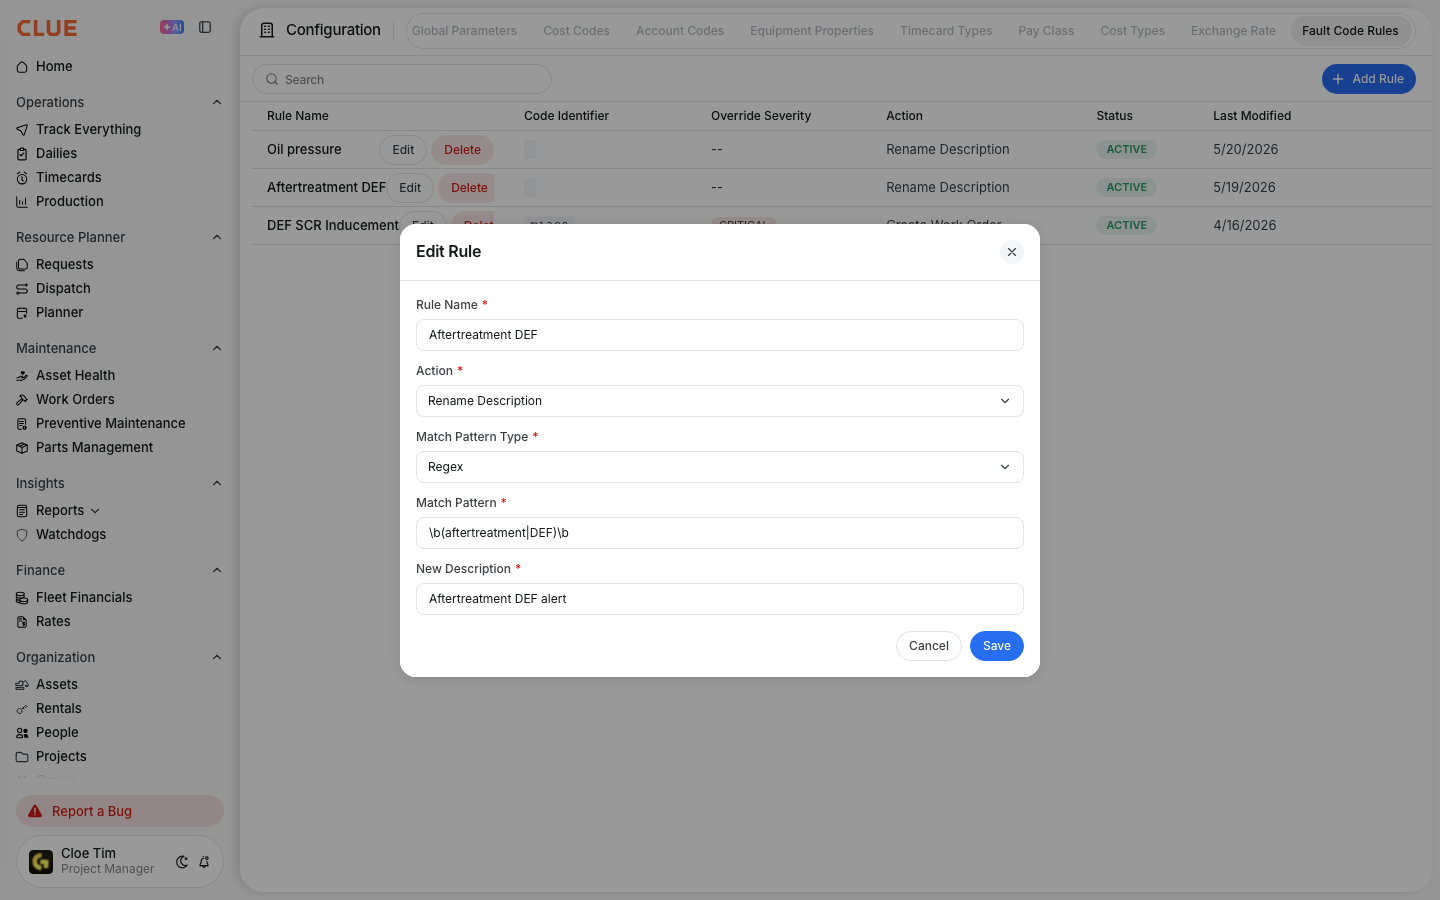
Connected telematics fault codes show severity levels: Critical in red, Warning or Monitor in yellow, and Minor or Informational in blue. The Fault Code Rules Engine lets your team set one rule per fault code. A rule can create a work order with a priority, keep an alert, override severity, dismiss nuisance codes while keeping them in history, or rename descriptions in plain English.
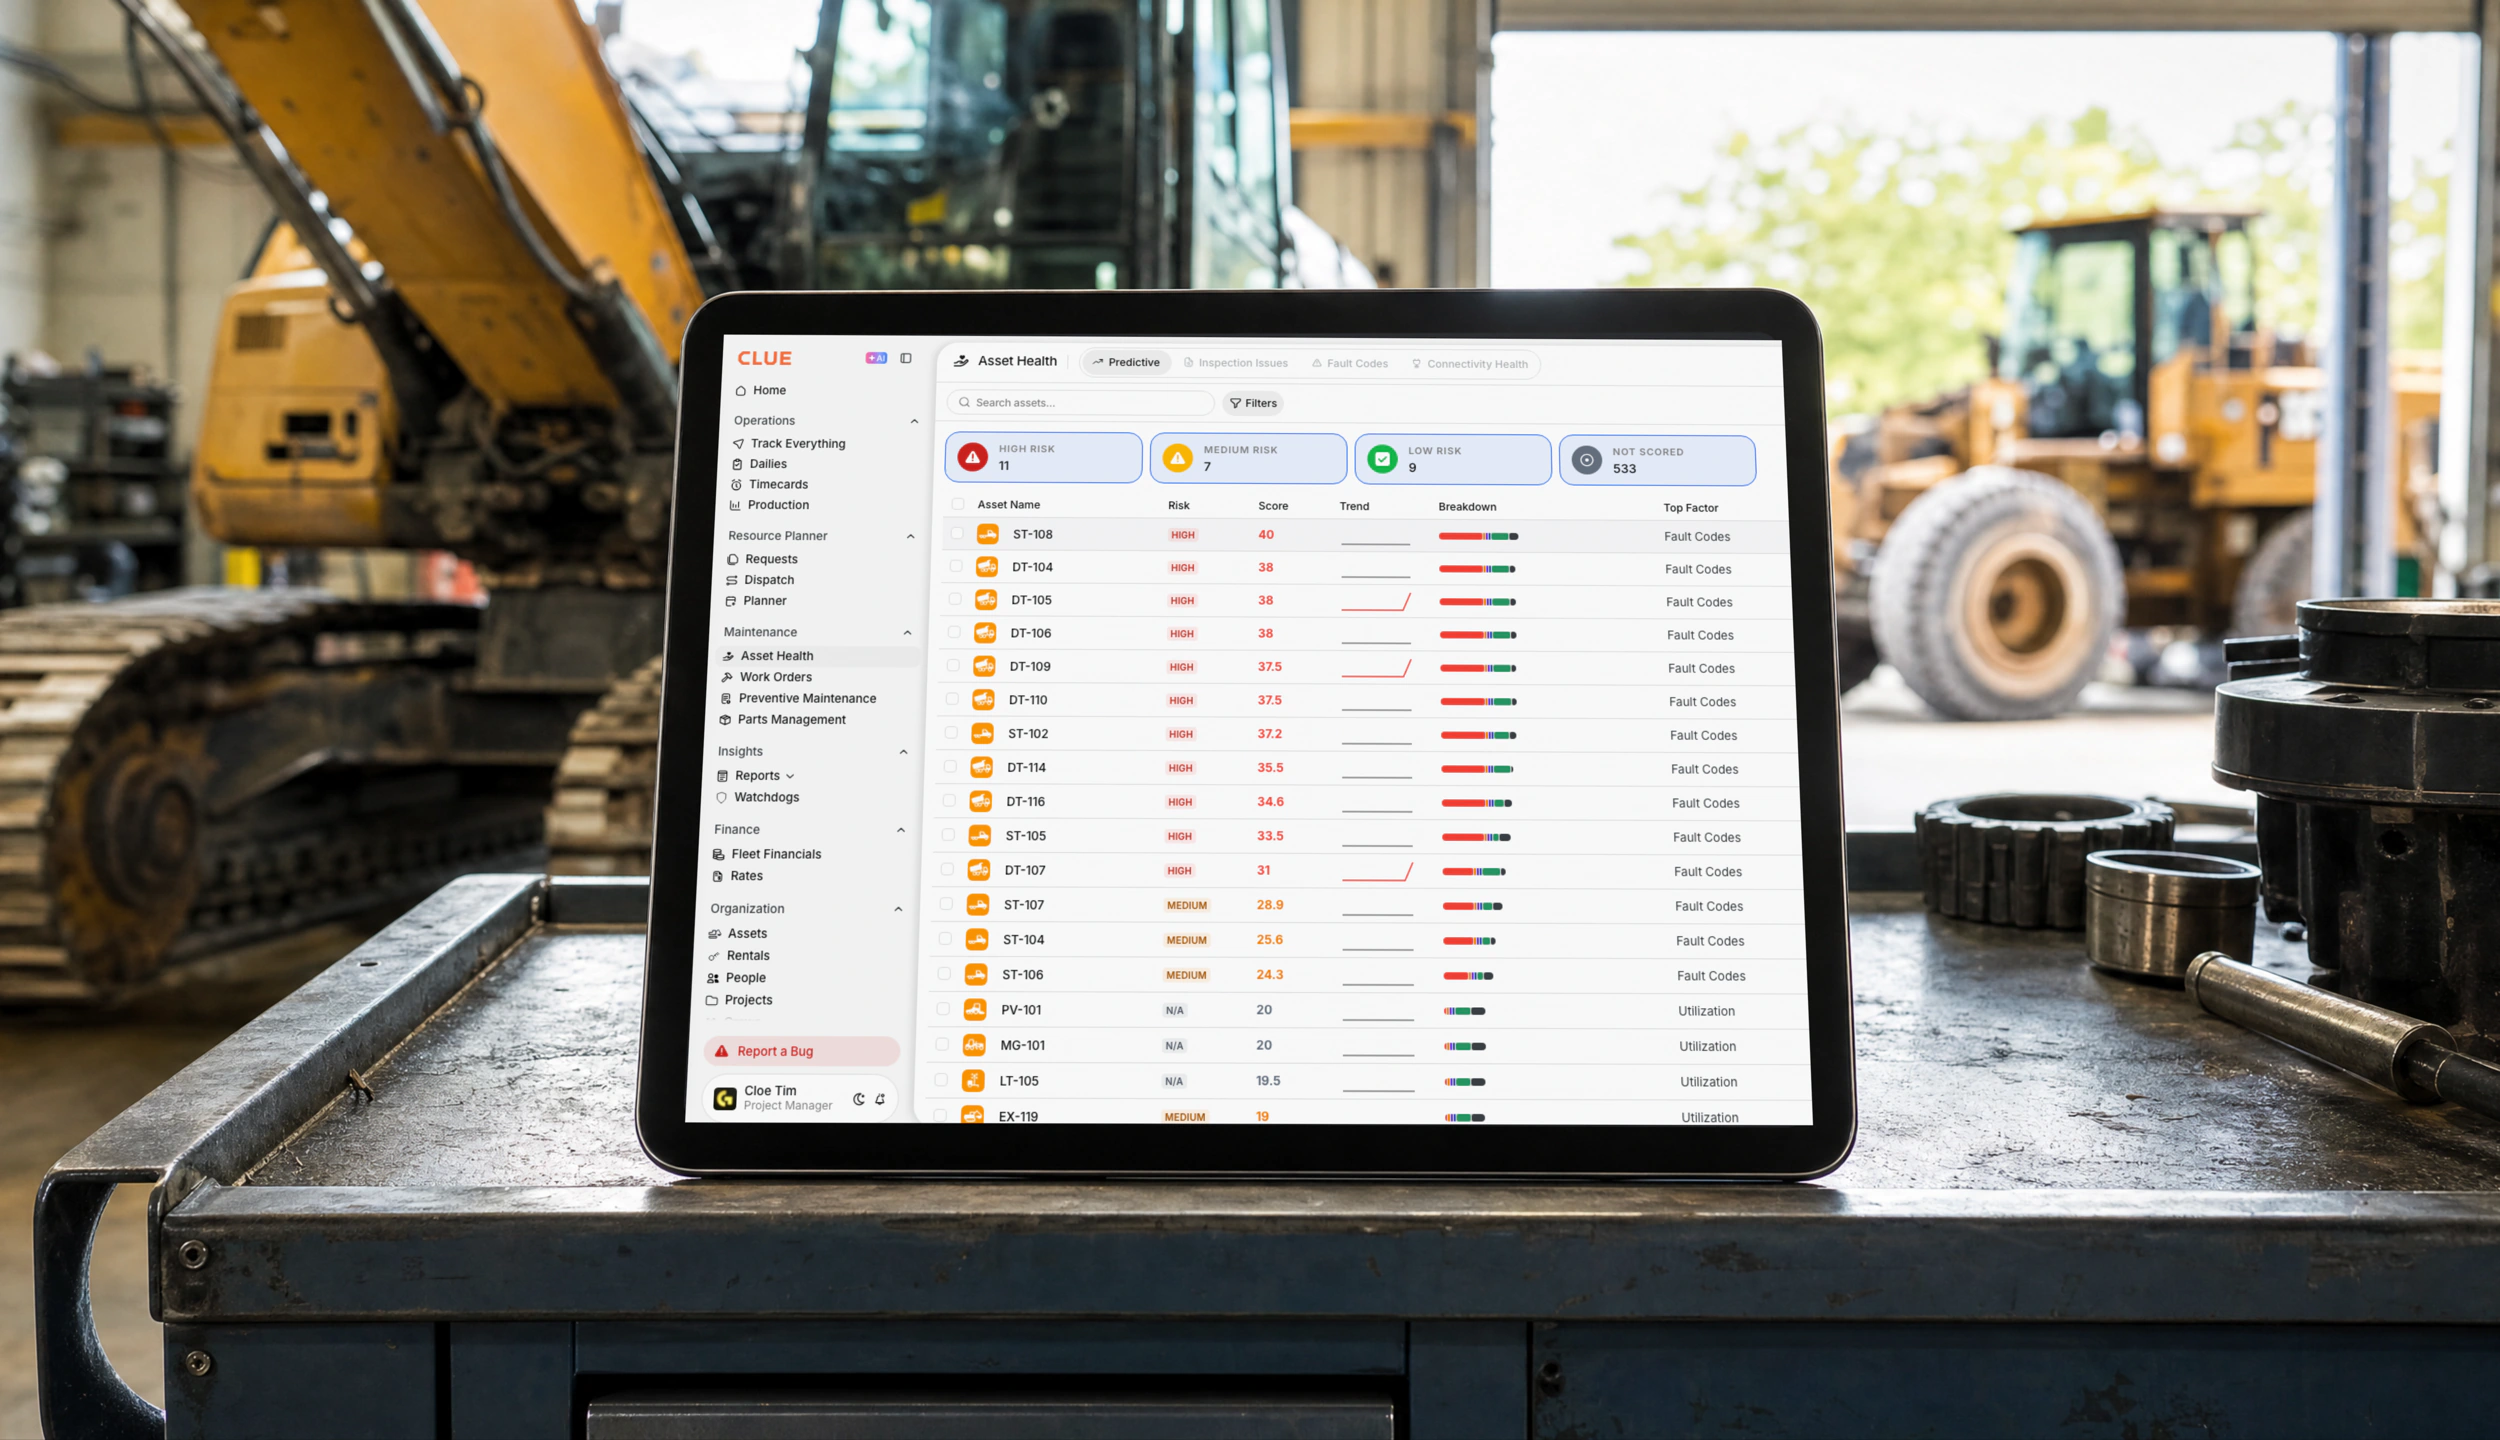
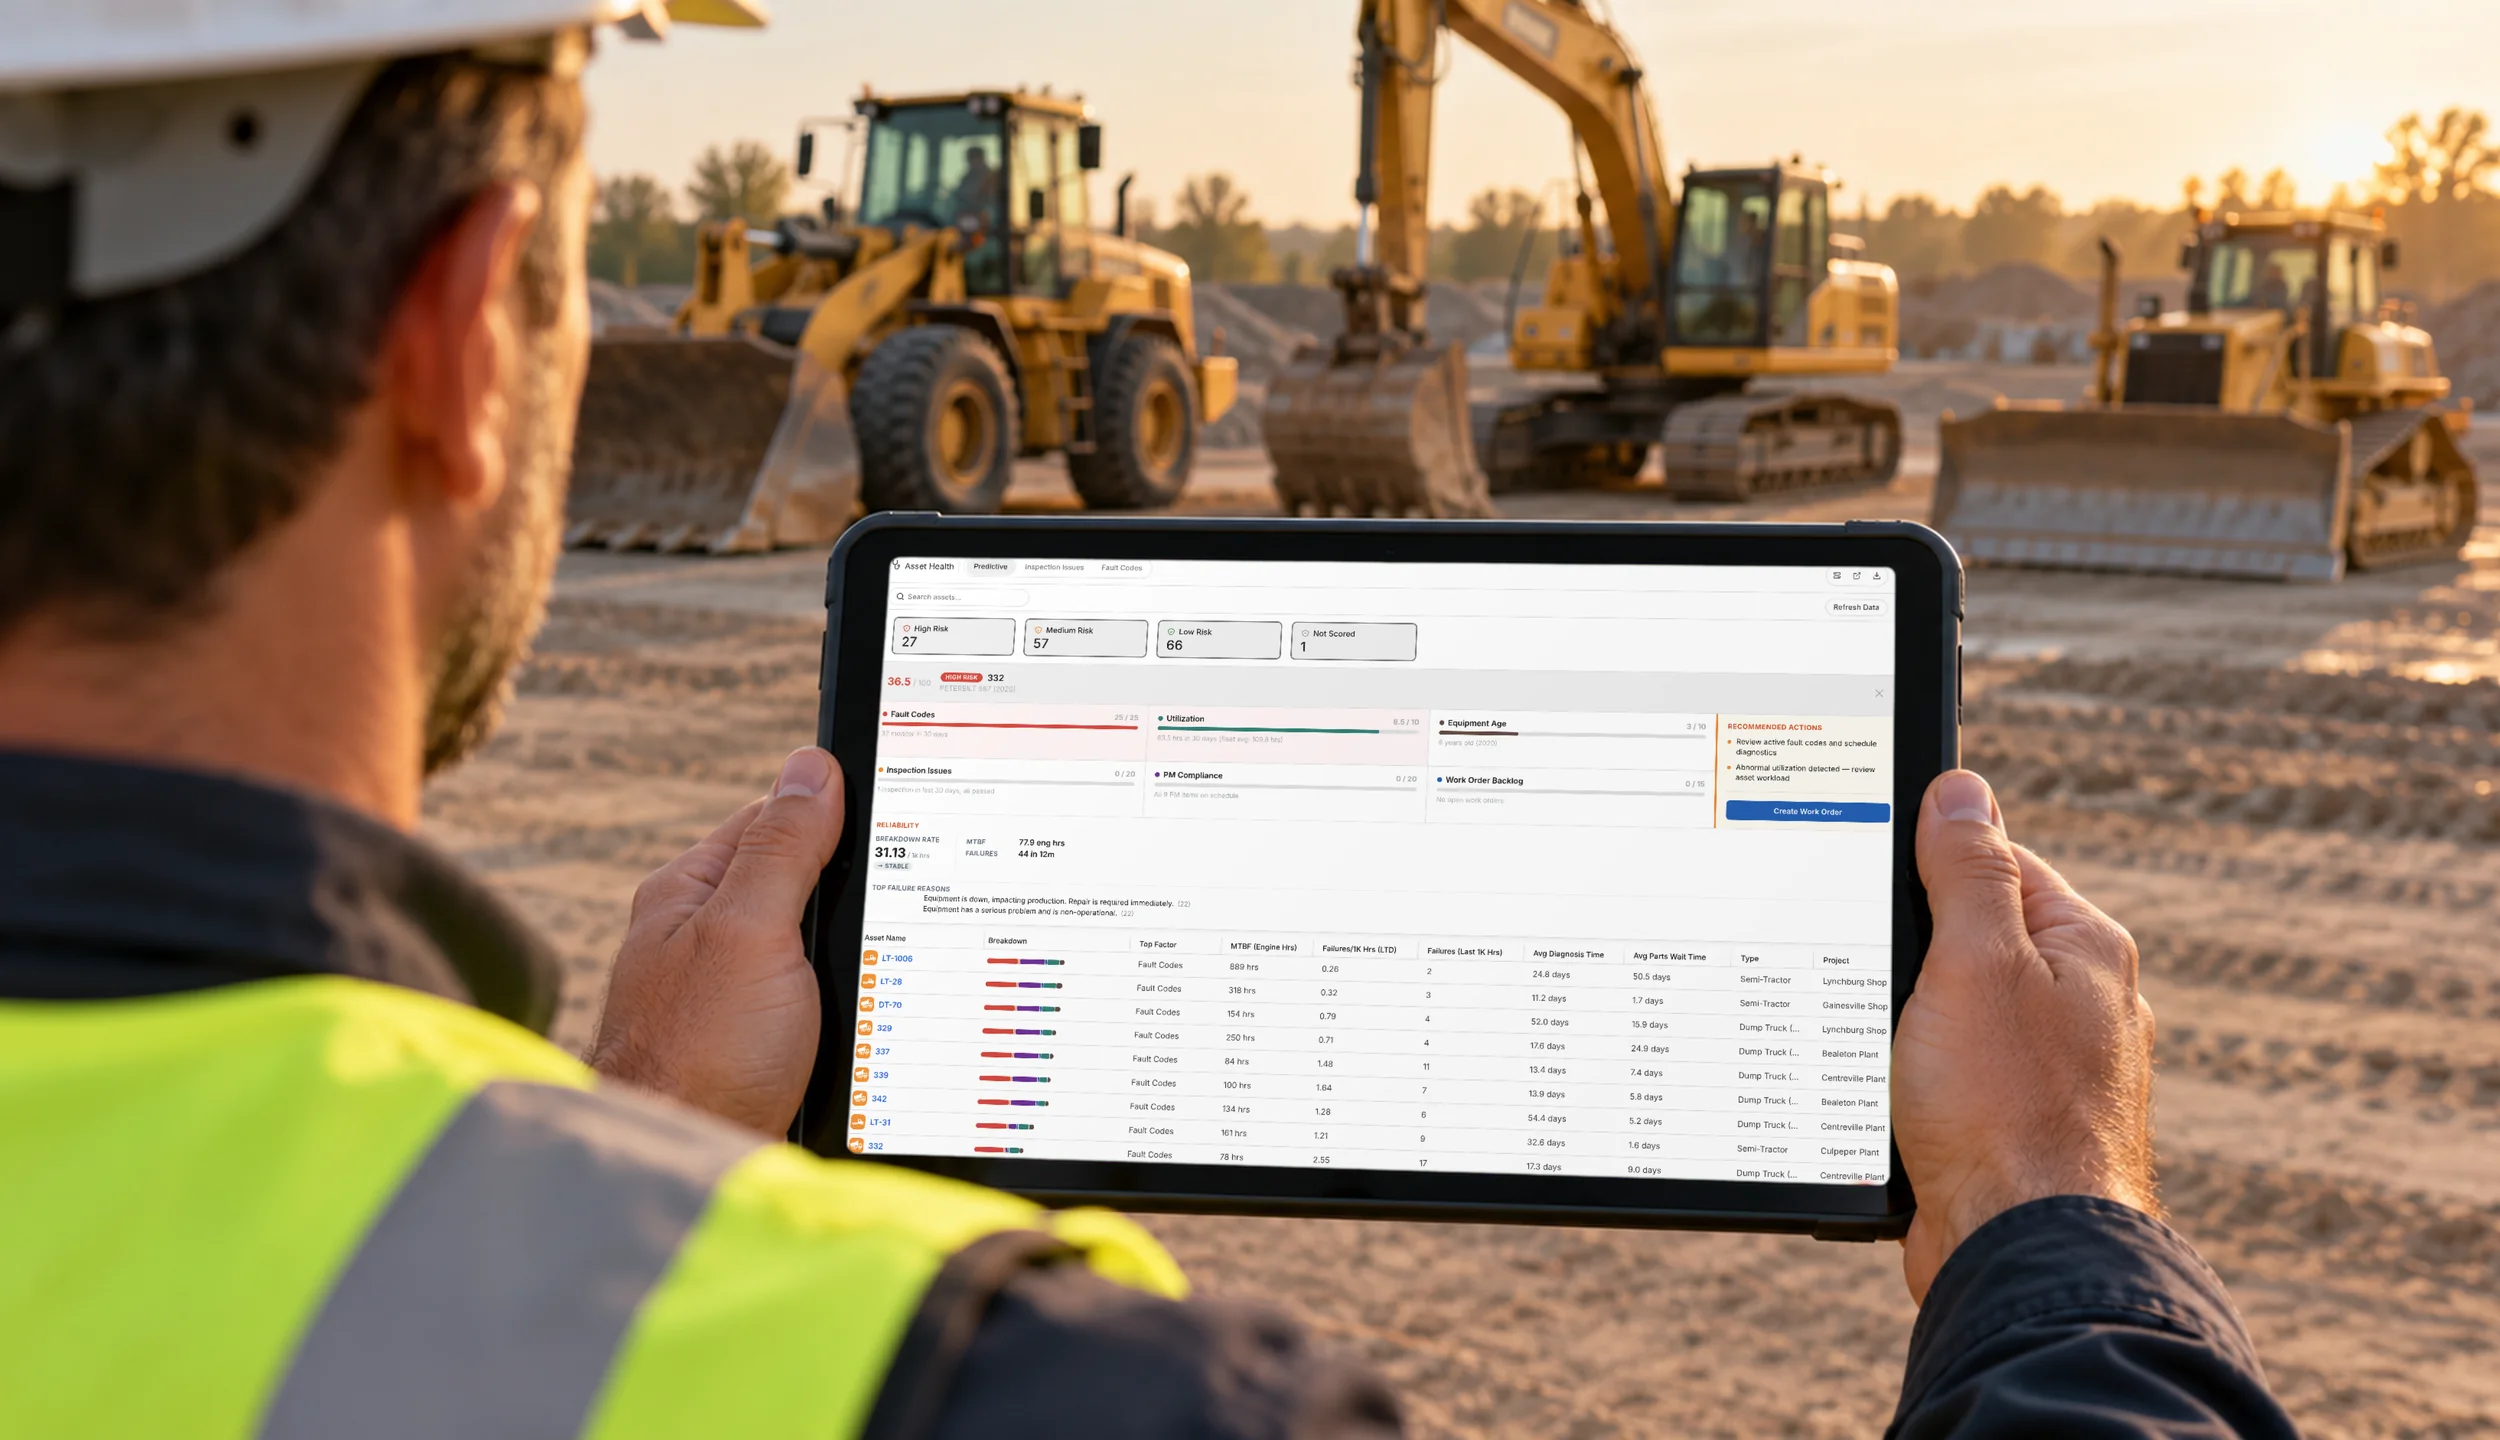
Failed inspection items and fault codes can create work orders with the asset, issue description, severity, and photos, linking each finding to repair history. Preventive maintenance plans schedule PM tasks. Where predictive maintenance is enabled, the Predictive dashboard gives each asset a risk score and shows its top driver, such as fault codes or usage. Clue turns FMEA actions into rules, inspections, and PM tasks.
Final Thoughts
The excavator hose in the trench is a repair your team can close today. It can also start a useful FMEA. Review repair history, find the repeat pattern, and give someone a clear next step.
This week, pick the asset class with the lowest mean time between failures. Pull the last 12 months of work orders and fault codes. Run a first two-hour FMEA session on its top 10 failure modes.
If Clue is on your shortlist, book a demo and bring the asset class that keeps breaking down.
FAQs
What Is FMEA in Maintenance?
FMEA in maintenance is a review of how equipment could fail, what each failure could cause, and how to prevent or catch it. The team records causes, effects, and controls for each failure. This gives mechanics, operators, and managers a shared plan for maintenance work.
What Are the Steps of an FMEA?
For equipment in service, run eight steps: pick one asset class, build a small team, break the machine into systems, list failure modes, describe effects and causes, record current controls, score severity, occurrence, and detection, and assign actions with owners and dates. The AIAG & VDA Handbook defines a seven-step method for automotive design and process FMEAs.
What Do Severity, Occurrence, and Detection Mean in FMEA?
Severity rates how serious a failure's effect is, from a minor annoyance to a safety hazard. Occurrence rates how often the failure happens in that machine class. Detection rates how hard the failure is to catch before it causes harm. Each uses a 1 to 10 scale the team defines before scoring.
How Do You Calculate RPN?
RPN is calculated by multiplying severity, occurrence, and detection scores. For example, scores of 7, 6, and 5 give an RPN of 210. Keep each score beside the result so the team can see what shaped the ranking. RPN alone does not show which score drove the result.
What Is a Good RPN Score?
There is no universal good RPN score. Teams set their own action threshold after scoring several failure lines. They can review what the results mean for equipment, safety, and service needs before using the threshold. Any severity score of 9 or 10 gets an action regardless of RPN.
What Is the Difference Between FMEA and FMECA?
FMECA adds a criticality analysis to FMEA. This helps teams judge how important each failure is. They can compare effects across systems when planning maintenance work. The analysis can guide investment across a wider maintenance program.
When Should You Use FMEA for Equipment?
Use FMEA when one machine class keeps producing repeat failures, when downtime cost starts driving project delays, or when you add a new machine class to the fleet. It also fits before a busy season, so the team can add inspection items and PM tasks while machines are available.
How Often Should You Update an FMEA?
Update an FMEA after a major failure, when the team starts using a new machine class, or when work or service methods change. These events can change the failure cause, its effect, or the steps used to prevent or catch it. A review keeps the record useful for current work.
Who Should Be on an FMEA Team?
An FMEA team should include an equipment manager, shop manager, lead mechanic, experienced operator, and safety staff. Include someone who can approve parts, task time, or changes to operating guidance. That person can help connect recommendations to the decisions needed for the work.
What Is the Difference Between FMEA and Root Cause Analysis?
FMEA looks ahead at how equipment could fail. Root cause analysis looks back at a failure that has happened. Add confirmed findings from root cause analysis to the relevant FMEA line. Then check whether the cause, effect, or control needs an update.

Transform Your Equipment Management