Asset Reliability Report
Available now on Beta - This feature is in beta testing and will roll out to everyone soon.
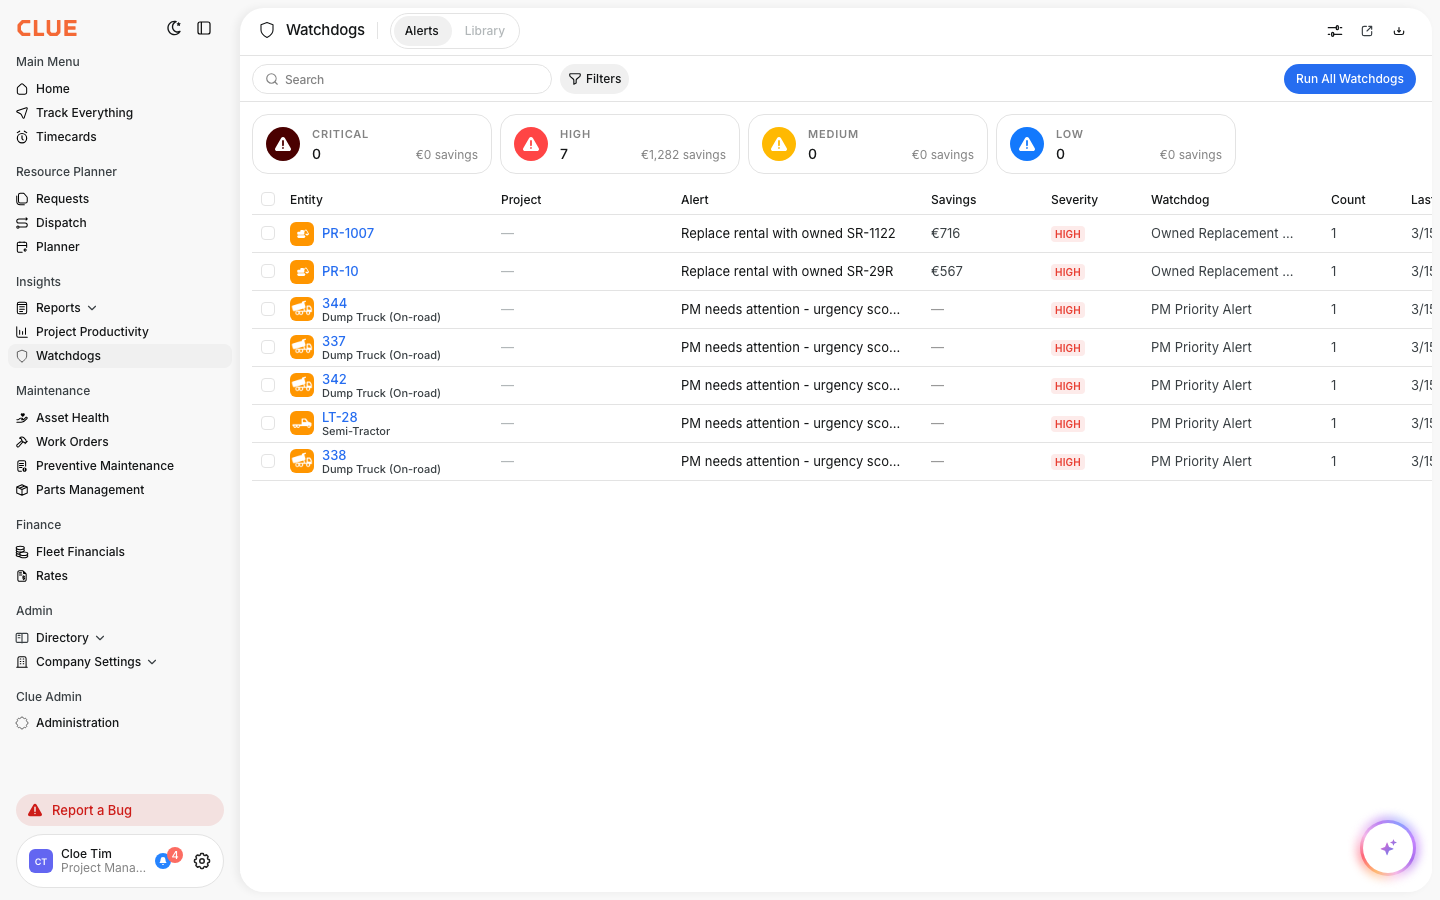
Use the Asset Reliability Report when you want a clearer picture of which equipment groups break down most often. It gives you MTBF data and recurring fault code trends so you can stop guessing and start working from actual numbers.
What is this?
The Asset Reliability Report shows how reliable your equipment is across the fleet. It calculates Mean Time Between Failures (MTBF) for each asset class and highlights the fault codes that come up most often.
This report is useful when you want to compare equipment groups, spot repeat problems, and dig deeper into assets that may be costing too much to keep running. It also fits naturally with Understanding Fleet Reports, Understanding the Asset Utilization Report, and Viewing Asset Work History when you want more context around performance and maintenance history.
Who is this for?
This report is useful for teams that need to make repair, replacement, and stocking decisions based on actual failure patterns. It helps connect reliability data to the day-to-day decisions happening in the shop and in fleet planning.
- Equipment Managers - identify which asset classes break down the most and decide what to repair or replace
- Shop Managers - see which fault codes keep coming back so they can prepare the right parts and response
- Operations Managers - export the data and combine it with cost reporting to find weak spots in the fleet
How to use it
Use this report when you want to review reliability across the fleet and then drill down into the groups or assets that need more attention. The basic flow is to open the report, choose the grouping you want, and then expand the categories you want to inspect more closely.
Step 1: Open the report
Go to Reports in the sidebar and select Asset Reliability.
The report opens with your fleet grouped by asset category, such as Off-road/Heavy or On-road, and shows MTBF and total fault code activity for those groups. This is also a natural place to link to Understanding Fleet Reports if the reader needs the bigger reporting overview first.
Step 2: Customize the data structure
Click Data Structure to choose how the report is grouped.
You can break the report down by Region, Project, Asset Category, Asset Type, Product Class, Make, or individual Asset. Choose the levels you want, then click Save. This is a strong internal linking spot for Using the AI Report Builder if the reader also wants custom reporting outside the standard layout.
Step 3: Drill into a category
Click the arrow next to any asset class to expand it and see more detail.
Each row shows total fault codes, MTBF in days, operating hours, miles, and the most frequent fault code for that group. This makes it easier to move from a high-level class view into the actual assets or sub-groups causing the issue. It also pairs well with Viewing Asset Work History when you want to review the maintenance story behind the numbers.
The full details
This report is built to help teams compare reliability across equipment groups and then export the data for deeper review if needed. It is designed for analysis, not just a quick dashboard check.
- Works on: Web app
- MTBF calculation: average days between fault code events across all assets in a class
- Date range: selectable by year, with the current year shown by default
- Filters: date range plus standard report filters
- Export: full data can be exported for outside analysis
- Grouping levels: Region, Project, Asset Category, Asset Type, Product Class, Make, and Asset
Tips
A few simple habits make this report more useful. The goal is to find the weak areas quickly, then connect those findings to real maintenance and replacement decisions.
- Sort by MTBF from low to high to find the least reliable asset classes first
- Check the Most Frequent Code column to spot repeat problems that may point to a larger issue
- Export the report and review it next to cost data so you get a better repair-vs-replace view
- Use Viewing Asset Work History after you spot a problem group so you can see the repairs, fault codes, and inspection issues behind it
- Pair this report with Understanding the Asset Utilization Report if you also want to compare reliability against usage levels