Rental Report
The Rental Report shows you what you are spending on rented equipment. It totals your rental cost, charts your historical rental spending over time, and breaks the numbers down by subsidiary and division. Use it to control rental spend and decide when to buy instead of rent.
What is this?
The Rental Report pulls all your rental costs into one place. You see the total cost, the number of rented assets, and how spending has trended month over month.
Who's this for?
- Equipment managers, keep an eye on rental spend across the company.
- Finance, review rental cost trends and budgets.
- Owners, decide when owning beats renting.
How to use it
Step 1: Open the report
In the main menu, open Reports, then click Rental Report. It is also linked from the Rentals tab in the Asset Directory.

Step 2: Read the spending cards
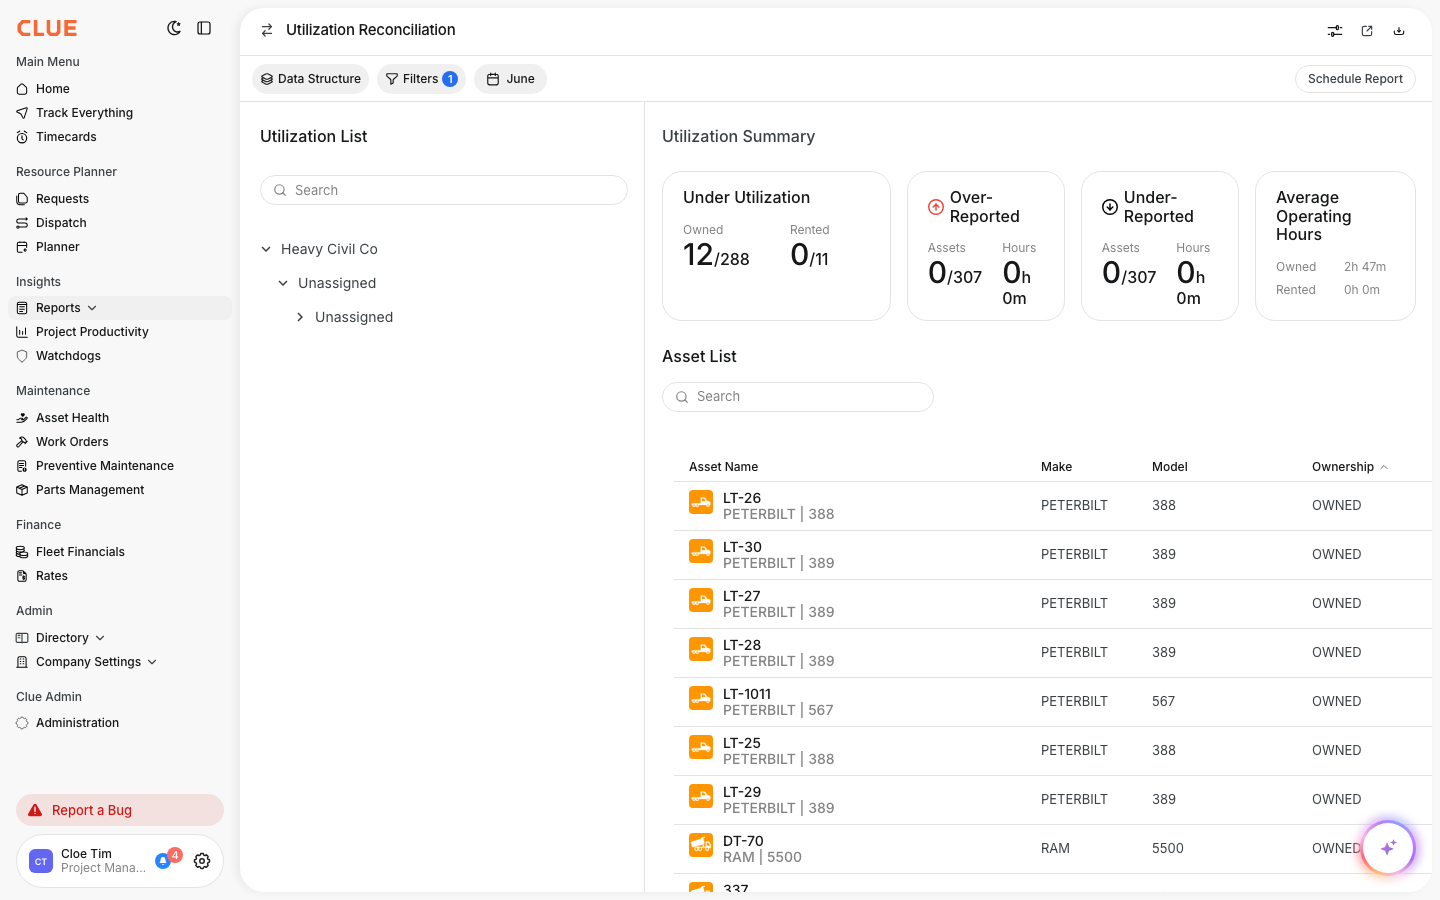
The Rental Spending card shows total cost and the number of rented assets. The Historical Rental Spending chart shows the trend over time.
Step 3: Break it down
The table lists units, rental cost, and operating hours by subsidiary and division. Use the date button to change the period.
The full details
- Works on: Web app
- Where to find it: Reports > Rental Report, or Asset Directory > Rentals
- Visibility: This report shows in your menu only if your company has it enabled.
Tips
- Switch the chart to Company Total or a single division to compare spend.
- Watch for rentals with high hours, those are often cheaper to own.