Performance Dashboard
The Performance Dashboard shows you which machines are pulling their weight and which are not. It ranks your assets into top performers and bottom performers using a utilization index, and it plots them on a live map. Use it to move idle equipment and get more out of your fleet.
What is this?
The Performance Dashboard scores each asset on how much it is used, then sorts the fleet into top and bottom performers. The map shows where each machine is right now, so you can act on what you see.
Who's this for?
- Equipment managers, find under used machines and redeploy them.
- Dispatchers, see where the best and worst performers are located.
- Owners, get a quick read on fleet productivity.
How to use it
Step 1: Open the dashboard
In the main menu, open Reports, then click Performance Dashboard.
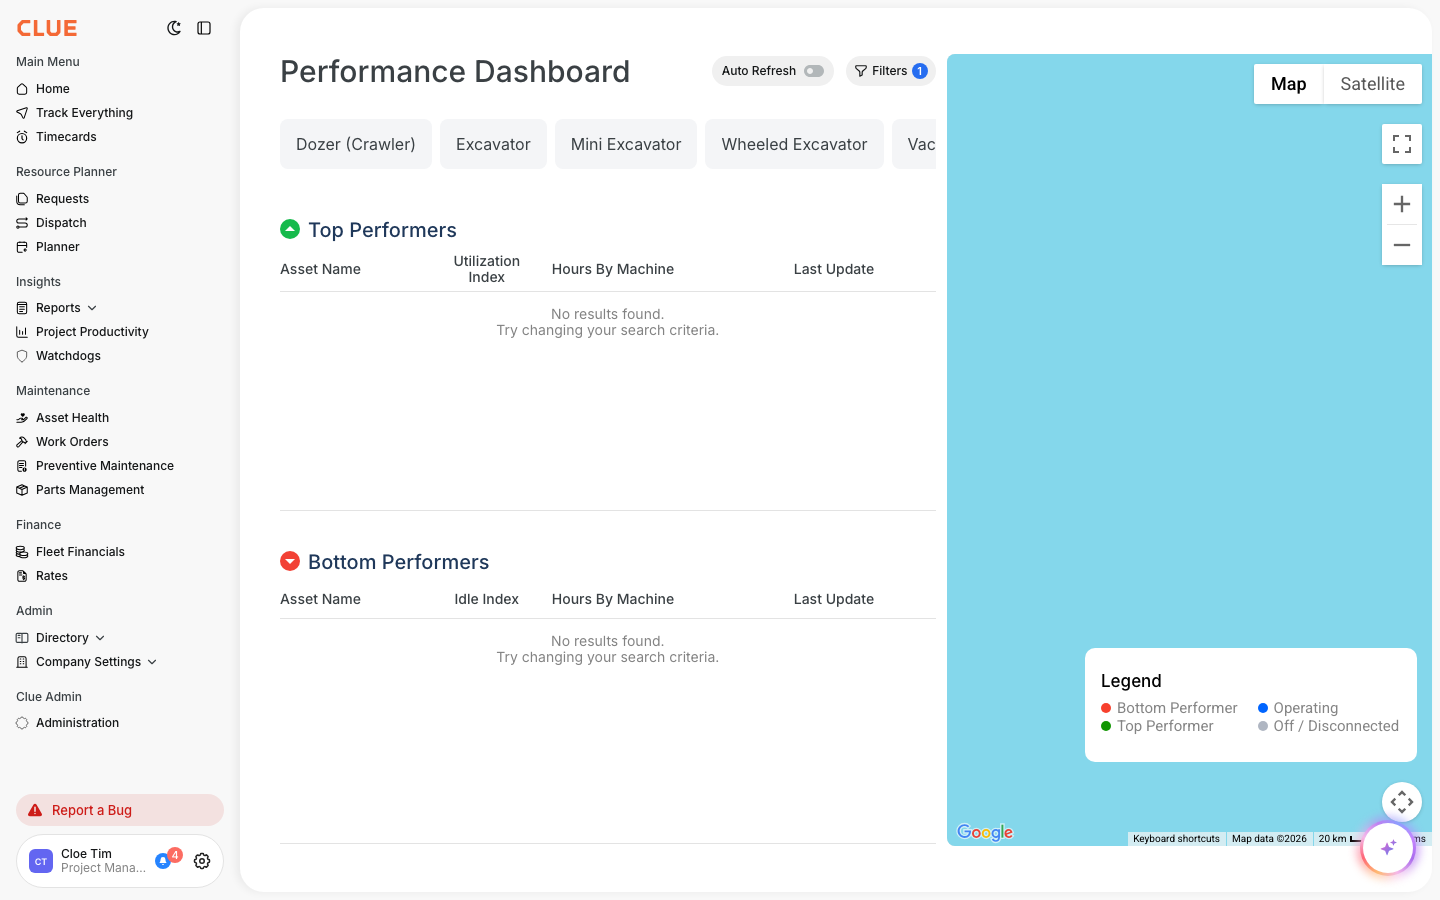
Step 2: Pick an asset type
Use the asset type chips at the top (Dozer, Excavator, and more) to compare like with like.
Step 3: Read top and bottom performers
The Top Performers and Bottom Performers lists rank assets by their utilization index. The map shows each one, colored by performance.
The full details
- Works on: Web app
- Where to find it: Reports > Performance Dashboard
- Visibility: This report shows in your menu only if your company has it enabled.
Tips
- Filter by asset type before comparing, a dozer and a pickup are not the same job.
- Turn on Auto Refresh to keep the map current during the day.