What Metrics Should You Use to Measure Equipment Reliability?


Hi, I’m Maham Ali. I write about construction equipment management, helping teams use fleet data and maintenance intelligence to improve uptime, control costs, and run smoother jobsites.
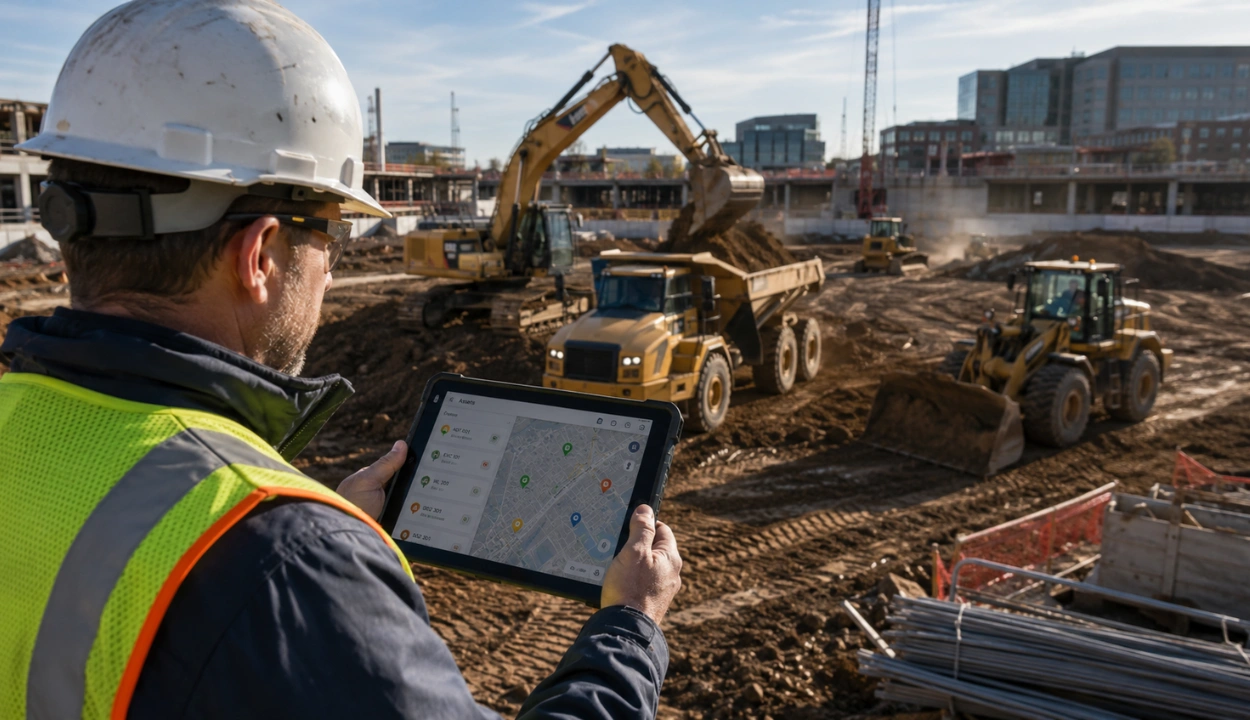
When heavy equipment is used on a busy construction site, it is almost as if you are leading an overwhelmed orchestra, where everything must function together. When equipment fails without warning, work stops, budgets are drained and goals are missed. In today’s competitive construction landscape, the ability to predict, measure, and improve equipment reliability is no longer a “nice to have”, it’s mission-critical.
By the end, you’ll understand how these numbers translate into real-world decisions, where Clue fits into the story, and how to turn data into action on the jobsite.
What is Equipment Reliability?
Equipment reliability is the ability of a machine or asset to perform its intended function without failure over a specified period, under defined operating conditions.
In short, it looks at how often equipment runs well before it needs to be fixed. Lower chance of breakdowns, shorter periods where equipment does not work and easy-to-predict results are all important in construction since delays can be costly and pose safety risks.
Why Reliability Matters in Construction

Let’s say you have the job of a site superintendent in charge of a mid-sized project involving earth-moving. Excavators, dozers, loaders and haul trucks can be seen and heard rumbling every day on the site. Your main contractor requests daily updates on the amount of work done and the owner wants all the expenses to be well planned.
Then one morning, the 350-horsepower excavator’s hydraulic pump fails, unplanned downtime. Crews stand idle.
A scheduled pour at the foundation is delayed. How much does an hour of unplanned downtime cost? Easily $14,056 per minute in equipment, labor, and scheduling ripple effects.
- Safety Risks: Unreliable machines often have hide-and-seek issues (leaky hydraulics, cracked hoses) that can turn into safety incidents.
- Budget Overruns: Every breakdown eats into contingency budgets. Parts, overtime, rental replacements, they all stack up.
- Schedule Creep: One delayed task ripples across submittals, inspections, and next-phase mobilizations.
- Crew Friction: Frustrated operators and mechanics burn out when they’re constantly putting out fires instead of executing planned work.
Reliability metrics exist to bring clarity to this chaos. Rather than relying on gut feel or “we’ve never seen this break before,” these KPIs give you a playbook:
- Identify which machines are most likely to fail (MTBF).
- Quantify how fast you can put them back into service (MTTR).
- Failure Rate shows how frequently failure happens within a given time or usage period
- Calculate the net effect on your uptime (Availability).
- Measure overall productivity (OEE).
- Track how much maintenance you’re doing proactively (PMP).
- Spot how often things slip into reactive mode (Unplanned Downtime).
Components of Equipment Reliability
- Design Quality: The basis of reliable equipment comes from using sturdy engineering and top-rated materials. Machines that have been well designed decline less and are much easier to keep working.
- Preventive Maintenance: Spotting issues early and lengthening equipment life can be done by keeping up with inspections, lube jobs and changing parts.
- Operational Practices: When equipment is operated by trained operators using its intended methods, it wears less over time.
- Environmental Conditions: Working in dusty, humid or very hot places speeds up equipment wear and tear. You should consider these factors during the planning of maintenance.
- Data Monitoring: Seeing equipment condition in real time through telematics and condition monitoring means you can address possible problems right away.
Top 7 Core Reliability Metrics

1. Mean Time Between Failures (MTBF)
MTBF indicates the typical period of time equipment can run before breaking. With an MTBF of 1200 hours, the excavator will usually work for 1,200 service hours without having an unexpected breakdown.
Why MTBF Matters for Construction
- Prioritization: The fact that your backhoe only lasts 800 hours compared to the loader’s 2,500 tells you where to put your efforts and efforts.
- Procurement Decisions: If choosing between the Caterpillar 320 and another excavator, seeing how reliable they have been in the past can help you decide.
- Budget Forecasting: With a known MTBF, you can estimate future breakdown frequency and allocate parts and labor dollars accordingly.
How to Calculate MTBF
- Record total running hours of the machine over a specific period (e.g., 6 months).
- Find out how many failure events there were within the given period.
Compute: MTBF = Total Operational Time / Total Number of Failures
Example: The machine worked for 2,400 hours last year and suffered 3 breakdowns. In general, your dozer works for 800 hours before an important issue happens.
2. Mean Time To Repair (MTTR)
MTTR shows the typical amount of time one must wait for a device to repair and return to normal work.
Why MTTR Matters for Construction
- Crew Efficiency: A quick repair means equipment back in the field. If MTTR is high, say, 16 hours, it means your crew might be chasing parts, waiting on technician availability, or lacking standardized repair processes.
- Fleet Planning: If a machine takes an average of 10 hours to fix, you might keep a rental backup on standby during critical phases (excavation, grading).
- Service Provider Accountability: For third-party service contracts, MTTR is the ultimate yardstick. If your warranty provider’s average MTTR balloons, it’s time to renegotiate service-level agreements.
How to Calculate MTTR
- Record total downtime hours (sum of all repair durations).
- Count the total number of repairs during the same period.
Example: Over the past quarter, your wheel loader spent 40 hours in the shop across 5 repair events.

3. Failure Rate
Failure Rate measures how frequently a piece of equipment experiences breakdowns over a given period. It’s typically expressed as the number of failures per operational hour, day, or usage cycle.
Why Failure Rate Matters for Construction
- Fleet-Level Insight: While MTBF focuses on individual machines, Failure Rate gives you a broader view across asset types or the whole fleet. If 5 out of 10 skid steers fail monthly, something's off design, usage, or maintenance.
- Risk Assessment: Frequent failures increase the chance of downtime at critical moments. Tracking this metric helps you assess which equipment poses the highest risk to productivity.
- Maintenance Strategy Alignment: A rising failure rate may indicate that your preventive maintenance schedule is outdated or that reactive fixes aren't addressing root causes.
How to Calculate Failure Rate
- Formula: Failure Rate = Number of Failures / Total Operating Time
Example: If a bulldozer logs 1,000 hours in a quarter and experiences 5 failures, its failure rate is: Failure Rate = 5 / 1,000 = 0.005 failures per hour
This means the dozer breaks down roughly every 200 hours. If that seems too frequent based on job type or manufacturer standards, it's time to dig deeper, literally and operationally.
4. Availability
Availability is the proportion of time a machine is ready for use out of the total time it should be in service. In essence:
Availability = MTBF / (MTBF + MTTR)
Where:
- MTBF = Mean Time Between Failures
- MTTR = Mean Time to Repair
This formula gives you the proportion of time equipment is available for use.
This gives you a percentage: if your machine’s MTBF is 1,000 hours and its MTTR is 10 hours,
Why Availability Matters for Construction
- Resource Planning: If a machine’s availability drops below 95%, you risk crew idle time, scheduling conflicts, and downstream delays.
- Billing & Utilization: In equipment-rental scenarios or internal chargebacks, availability directly translates to billable (or chargeable) hours.
- Safety & Compliance: Low availability may hide cascading minor stops or defects like a cracked boom pin or faulty sensor, that eventually cause bigger issues.
5. Overall Equipment Effectiveness (OEE)
OEE combines Availability, Performance and Quality into a single score. Initially, it was developed for manufacturing, though now it is helpful in any operation that uses machines.
- Performance: Are you running at expected production rates? If an excavator should dig 100 cubic meters/hour but is churning at 80 because of suboptimal attachments or operator training, performance is 80%.
- Quality: On a construction site, map “quality” to whether work passes inspection (e.g., rework percentage, failed soil compaction tests).
Availability = Runtime / Planned Production Time
Why OEE Matters for Construction
- Holistic View: Instead of treating equipment uptime in a vacuum, OEE shows whether you’re truly getting target output and correct work.
- Capital Allocation: OEE helps justify upgrading to newer, higher-performing machines or providing operator training where performance gaps persist.
6. Planned Maintenance Percentage (PMP)
PMP is the share of total maintenance time spent on scheduled (planned) tasks versus unscheduled (reactive) fixes. A classic formulation:
PMP = (Planned PM Hours / Total Maintenance Hours) × 100%
Where:
- Planned PM Hours = hours spent on scheduled preventive maintenance
- Total Maintenance Hours = total of all maintenance hours (planned + unplanned)
Result is expressed as a percentage indicating how much of your maintenance is proactive.
Why PMP Matters for Construction

- Predictive vs. Reactive: A high PMP (80–90%) means your shop isn’t constantly reacting to truck breakdowns or hydraulic hose leaks. Instead, you’re changing filters, greasing pins, and testing systems before they fail.
- Labor & Parts Efficiency: Planned maintenance is cheaper, your crew has parts on hand, knows the steps, and can bundle similar tasks across machines.
- Reliability Culture: A strong PM program shows you’re prioritizing reliability over “fix when it breaks” mindset.
7. Unplanned Downtime Rate
This KPI is also known as “failure frequency” and records how often sudden failures keep machines from being used during production:
Unplanned Downtime Rate = Unplanned Failures ÷ (Equipment Count × Time Period)
Why Unplanned Downtime Rate Matters for Construction
- Real-World Impact: Every unplanned hour costs labor, schedule, and potential safety hazards.
- Early Warning: A spike in unplanned downtime (e.g., you had 5 failures in April vs. 2 in March) signals possible root causes, aging fleet, poor fluid analysis, or weak PM quality.
- KPI Balance: While MTBF/MTTR and Availability are more granular, this metric shows the aggregate effect on your entire operation
Supporting KPIs: OEE, PMP, & Unplanned Downtime

While MTBF, MTTR, and Availability form the foundation, these supporting KPIs glue the bigger picture together.
Overall Equipment Effectiveness (OEE)
Traditional manufacturing OEE racks “good parts per hour,” but on-site, it translates to “correct work delivered per shift.” An excavator might be available 98% of the time, but if it’s stuck digging with the wrong bucket (performance loss) or trenches need rework (quality loss), you’re not hitting targets.
- Availability: From the uptime/downtime logs.
- Performance: Captured via production reporting, operators record bucket counts or cubic-yard totals through Clue’s daily checklist.
- Quality: Mapped to inspection checklists, compaction tests, depth tolerances, tolerable slope variances.
By combining these three, Clue shows you which machines are “star performers” and which consistently underdeliver, even when they’re running.

Planned Maintenance Percentage (PMP)
If your shop spends more time chasing fires than preventing them, your reliability program is backward.
Unplanned Downtime Rate
You might be hitting your preventative maintenance targets, but if you still average 3 unplanned failures per month, something’s off, maybe your PM checklists aren’t thorough enough, or you’re ignoring certain failure modes.
What Clue Does
- Failure reasons (tags) become searchable filters: “hydraulic,” “electrical,” “undercarriage.”
- You can break down failure frequency by model, by location, by jobsite conditions (e.g., “units running in dusty environments have 3× more hydraulic failures”).
Clue’s Component Tagging & Reliability Comparison
Clue lets you tag components in work orders, making it easy to track failures and compare equipment reliability across models—so you can fine-tune maintenance based on real data.
Putting It All Together
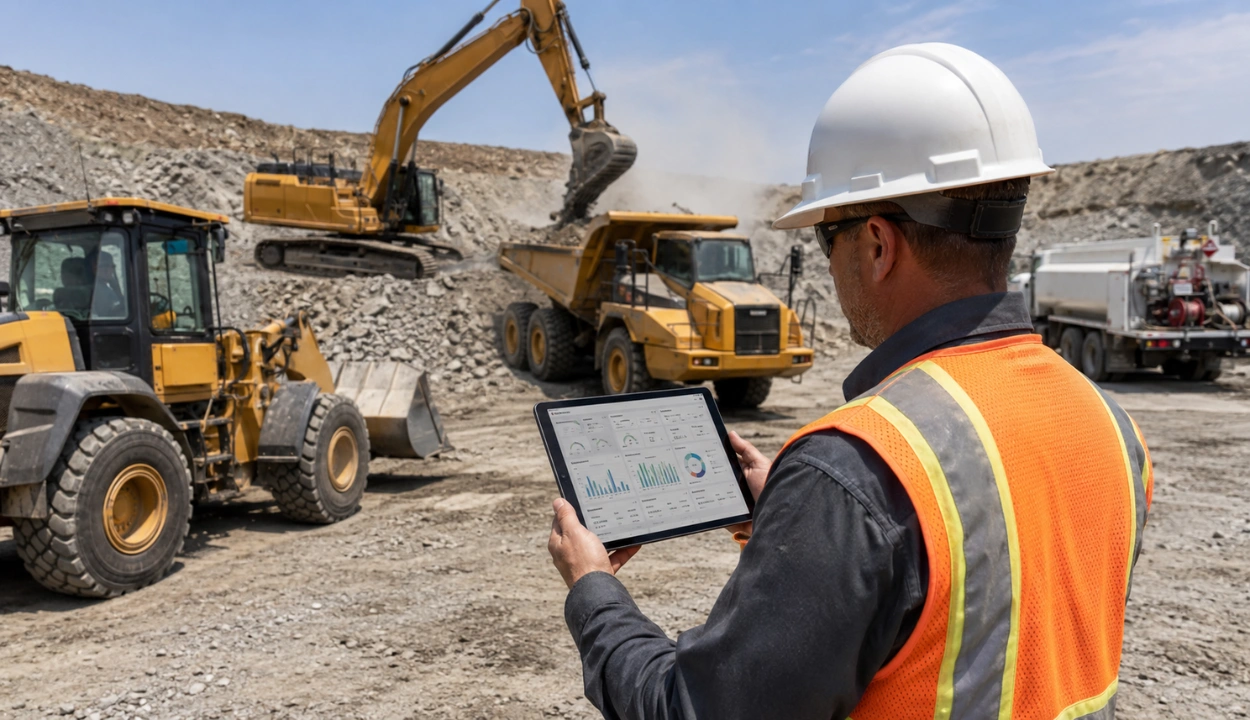
Clue was born from one simple but powerful idea: When data flows seamlessly from the field to the back office, decisions become smarter and crews stop scrambling. Here’s how Clue ties the entire reliability measurement process into a single, jobsite-ready platform:
- One Source of Truth for All Equipment Data
- From inspection checklists to failure logs, every data point lives in Clue’s single pane of glass. No more juggling paper forms, spreadsheets, or random sticky notes on a toolbox.
- Each machine’s complete history, downtime reasons, repair times, fluid analysis reports, lies at your fingertips.
- Automated KPI Calculation & Reporting
- Clue continuously churns through uptime/downtime entries to calculate MTBF and MTTR by make/model/jobsite.
- Availability updates in real-time on your dashboard, if that dozer stays in the shop two days straight, you see the availability dip instantly.
- Custom Alerts & Thresholds
- When a critical metric falls below your threshold, let’s say MTBF for “Wheel Loaders” drops under 500 hours, Clue sends email/SMS alerts to the equipment manager and shop foreman.
- If any asset’s availability dips under 90% in a given week, Clue surfaces it so you can decide whether to repair, replace, or relocate it.
- Mobile-First for Field Adoption
- Clue guides operators and mechanics with step-by-step, photo-enabled forms. Did the backhoe lose hydraulic pressure? The tech selects “Hydraulic,” snaps a picture of the fluid reservoir, and notes the fault code, all on their phone.
- Instantly, the repair workflow kicks off, back-office sees the request, checks parts availability, and assigns a technician, sometimes before the operator’s cup of chai is even cold.
Final Thoughts
In construction, reliability isn’t a luxury, it’s a requirement. When your equipment works as expected, you hit deadlines, protect margins, and deliver consistent quality to owners. By focusing on the six key metrics (MTBF, MTTR, Availability, OEE, PMP, Unplanned Downtime), you move beyond gut instincts and into a world of data-driven clarity.
Clue was built for teams just like yours, superintendents juggling tight deadlines, equipment managers steering large fleets, and fleet leads striving for leaner maintenance budgets. Ready to transform your fleet’s reliability?
Discover how Clue helps you track metrics, streamline maintenance, and keep every machine moving.
Transform Your Equipment Management