Site Map and Speed HeatMap
Available now on Beta, This feature is in beta testing and will roll out to everyone soon.
What is this?
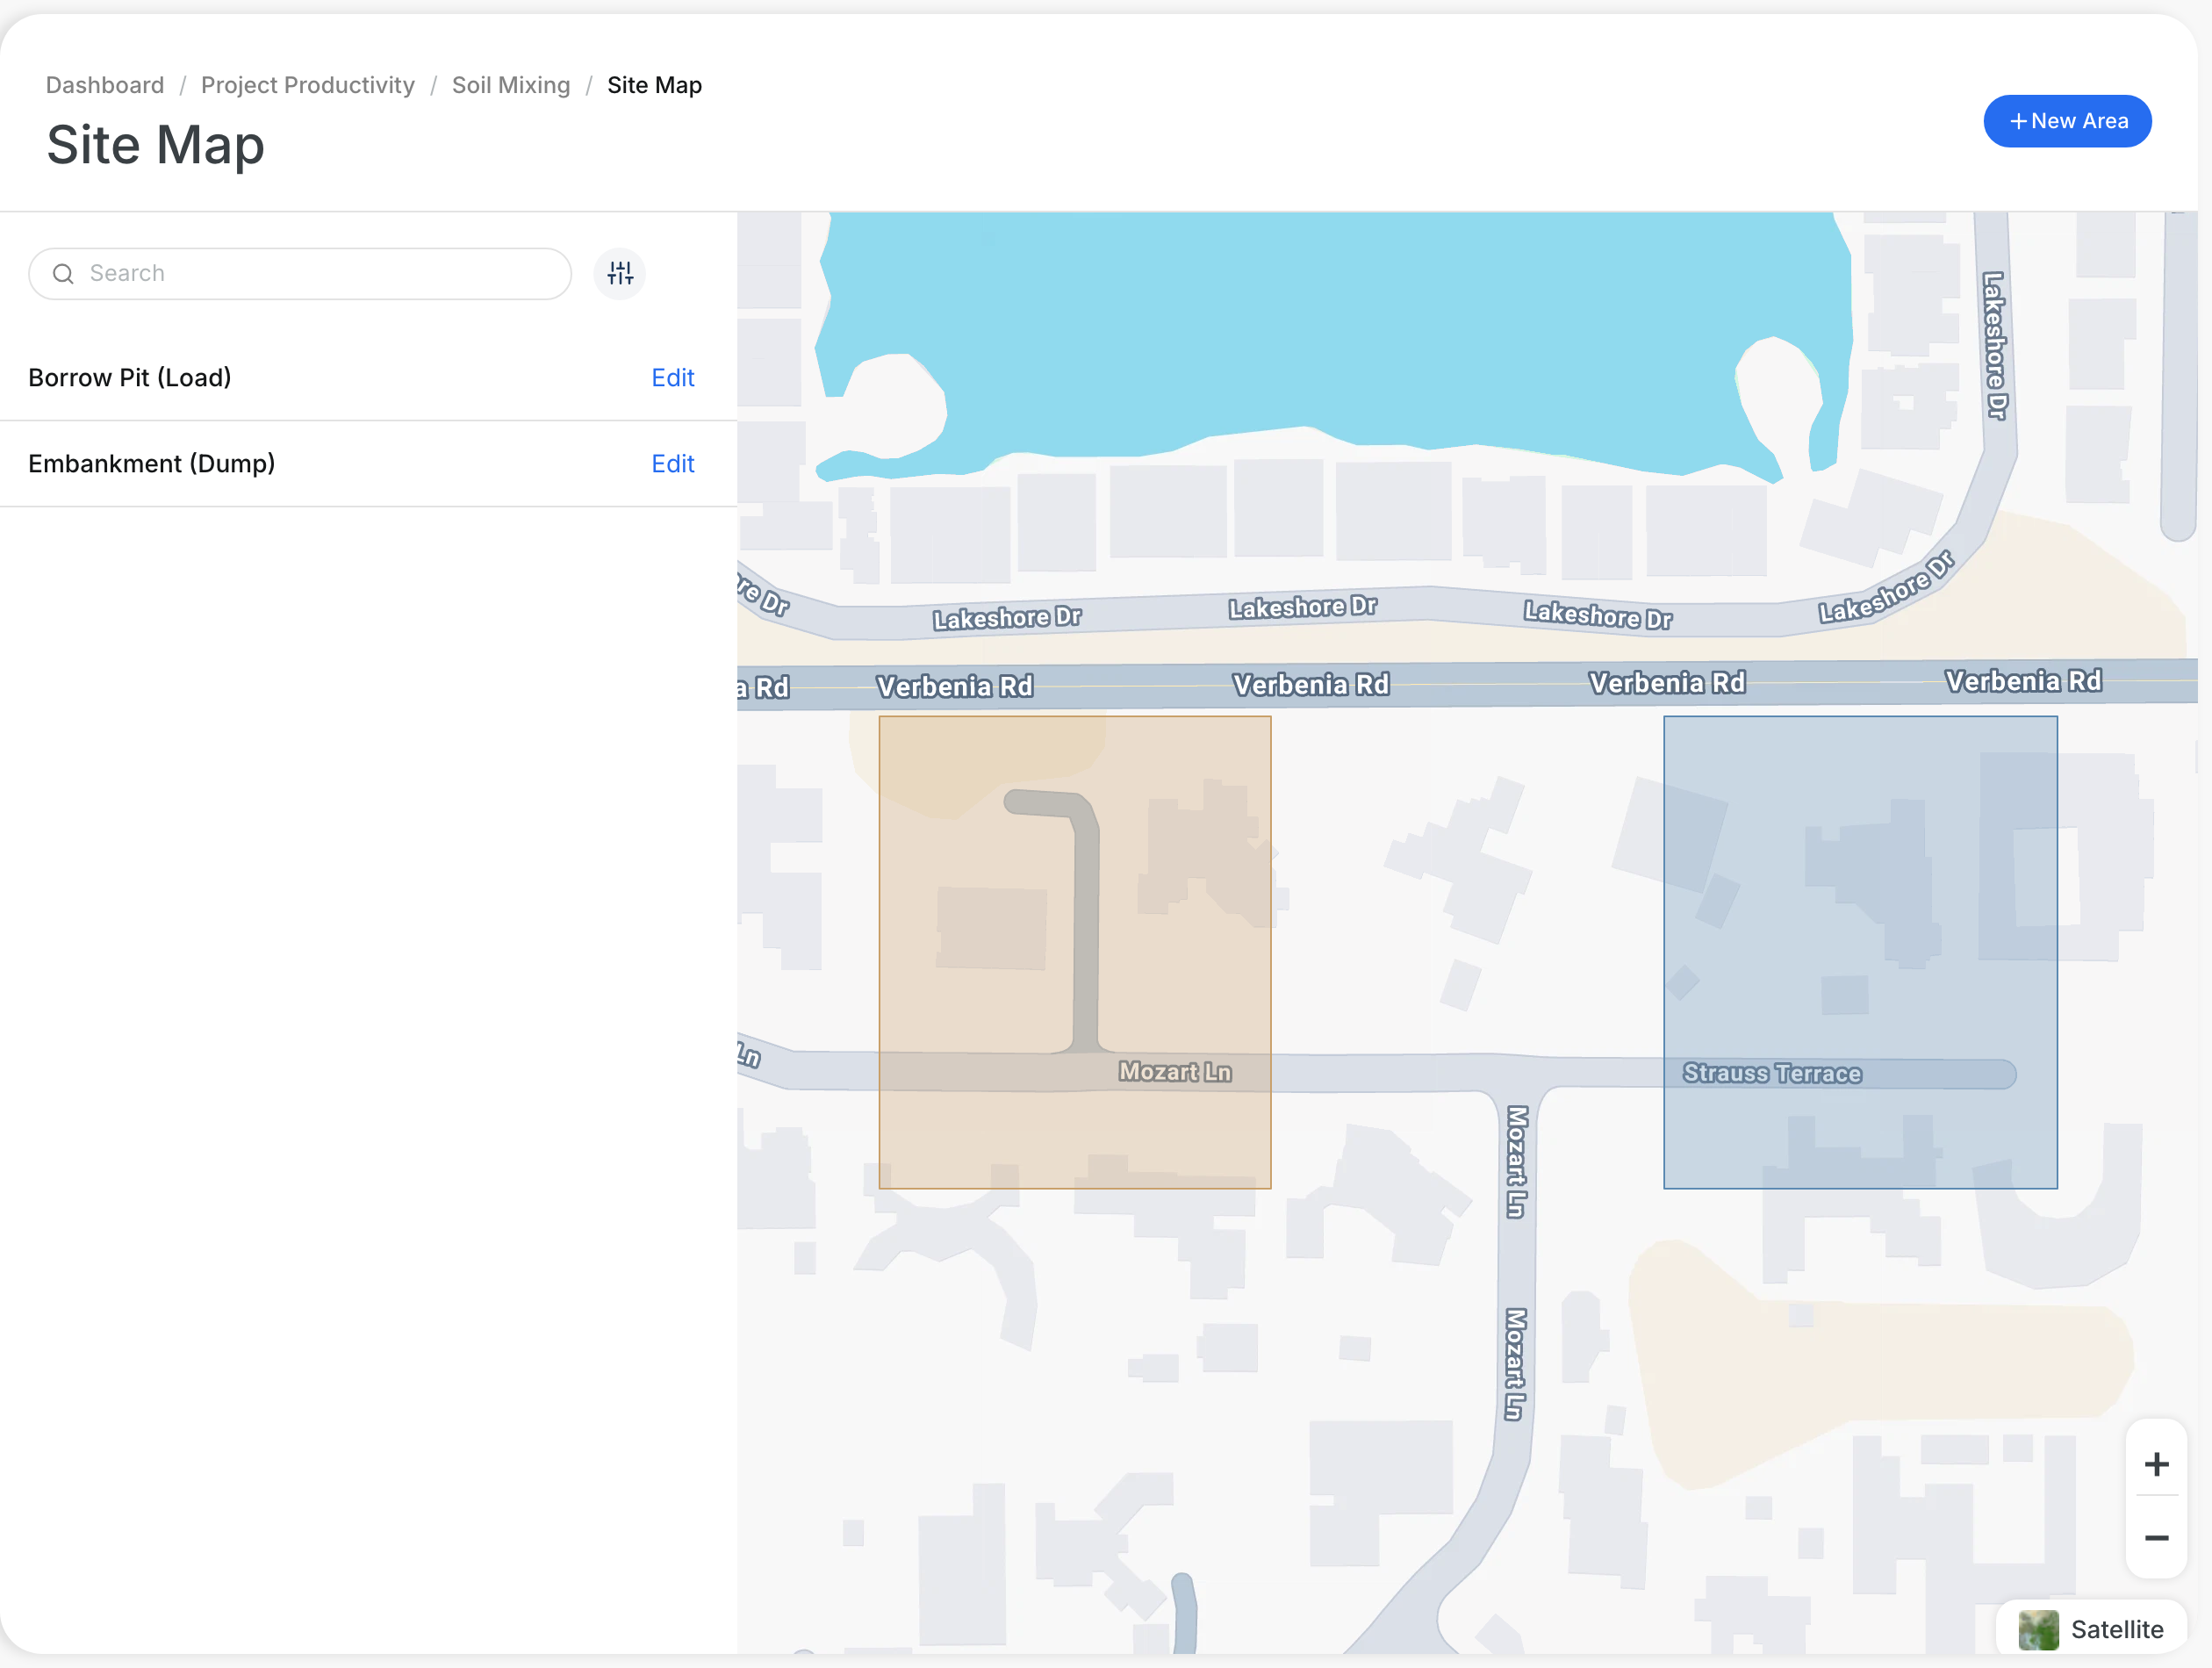
The Site Map shows the work Areas of a project on a map. Load Areas and dump Areas each show as a colored shape. The Speed HeatMap shows where your assets drove and how fast. Use both to check routes and slow spots.
Who's this for?
- Superintendents, to check where loading and dumping happen.
- Project managers, to review the site layout.
- Foremen, to find slow sections of the haul road.
How to use it
Step 1: Open the Site Map
Go to Operations > Production and click your project. Click Site Map at the top of the page.

Step 2: Review the Areas
The list shows each Area, such as Borrow Pit (Load) and Embankment (Dump). The map shows each Area in its own color.
Step 3: Open the Speed HeatMap
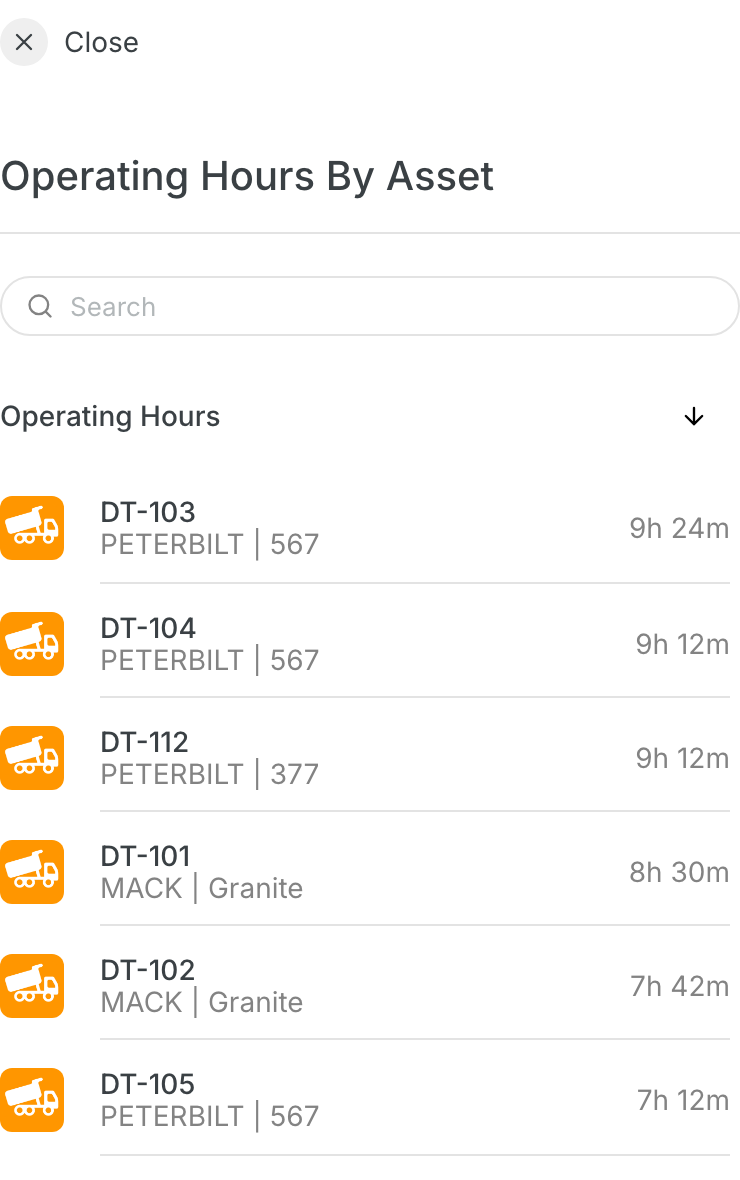
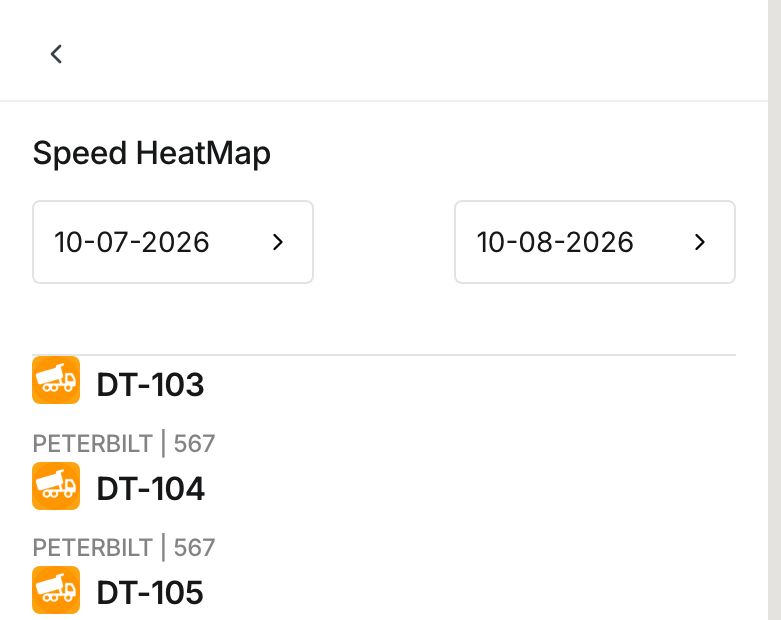
Go back to the project and click Speed HeatMap. Pick the start and end dates. The list shows the project assets.
The full details
- Site Map: shows the project Areas on a map.
- Area list: each Area has an Edit link.
- New Area: adds a new Area to the project.
- Speed HeatMap: shows asset paths for the dates you pick.
- Asset list: shows each project asset with its make and model.
Tips
- Name Areas by their job, for example "(Load)" or "(Dump)".
- Keep Areas tight around the real load and dump spots.
- Use Satellite view to match Areas to the ground.