Production Analysis Report
What is this?
Production Analysis shows what your crews built and what it cost. It compares the expected dollars for the work done with the actual dollars spent. You group the numbers by project, cost code, foreman or time period. Two charts and a table update together as you change the view.
Who's this for?
- Project managers, to see which projects and cost codes make or lose money.
- Superintendents, to compare production across foremen and weeks.
- Estimators, to check field results against the budget rates.
How to use it
Step 1: Open the report
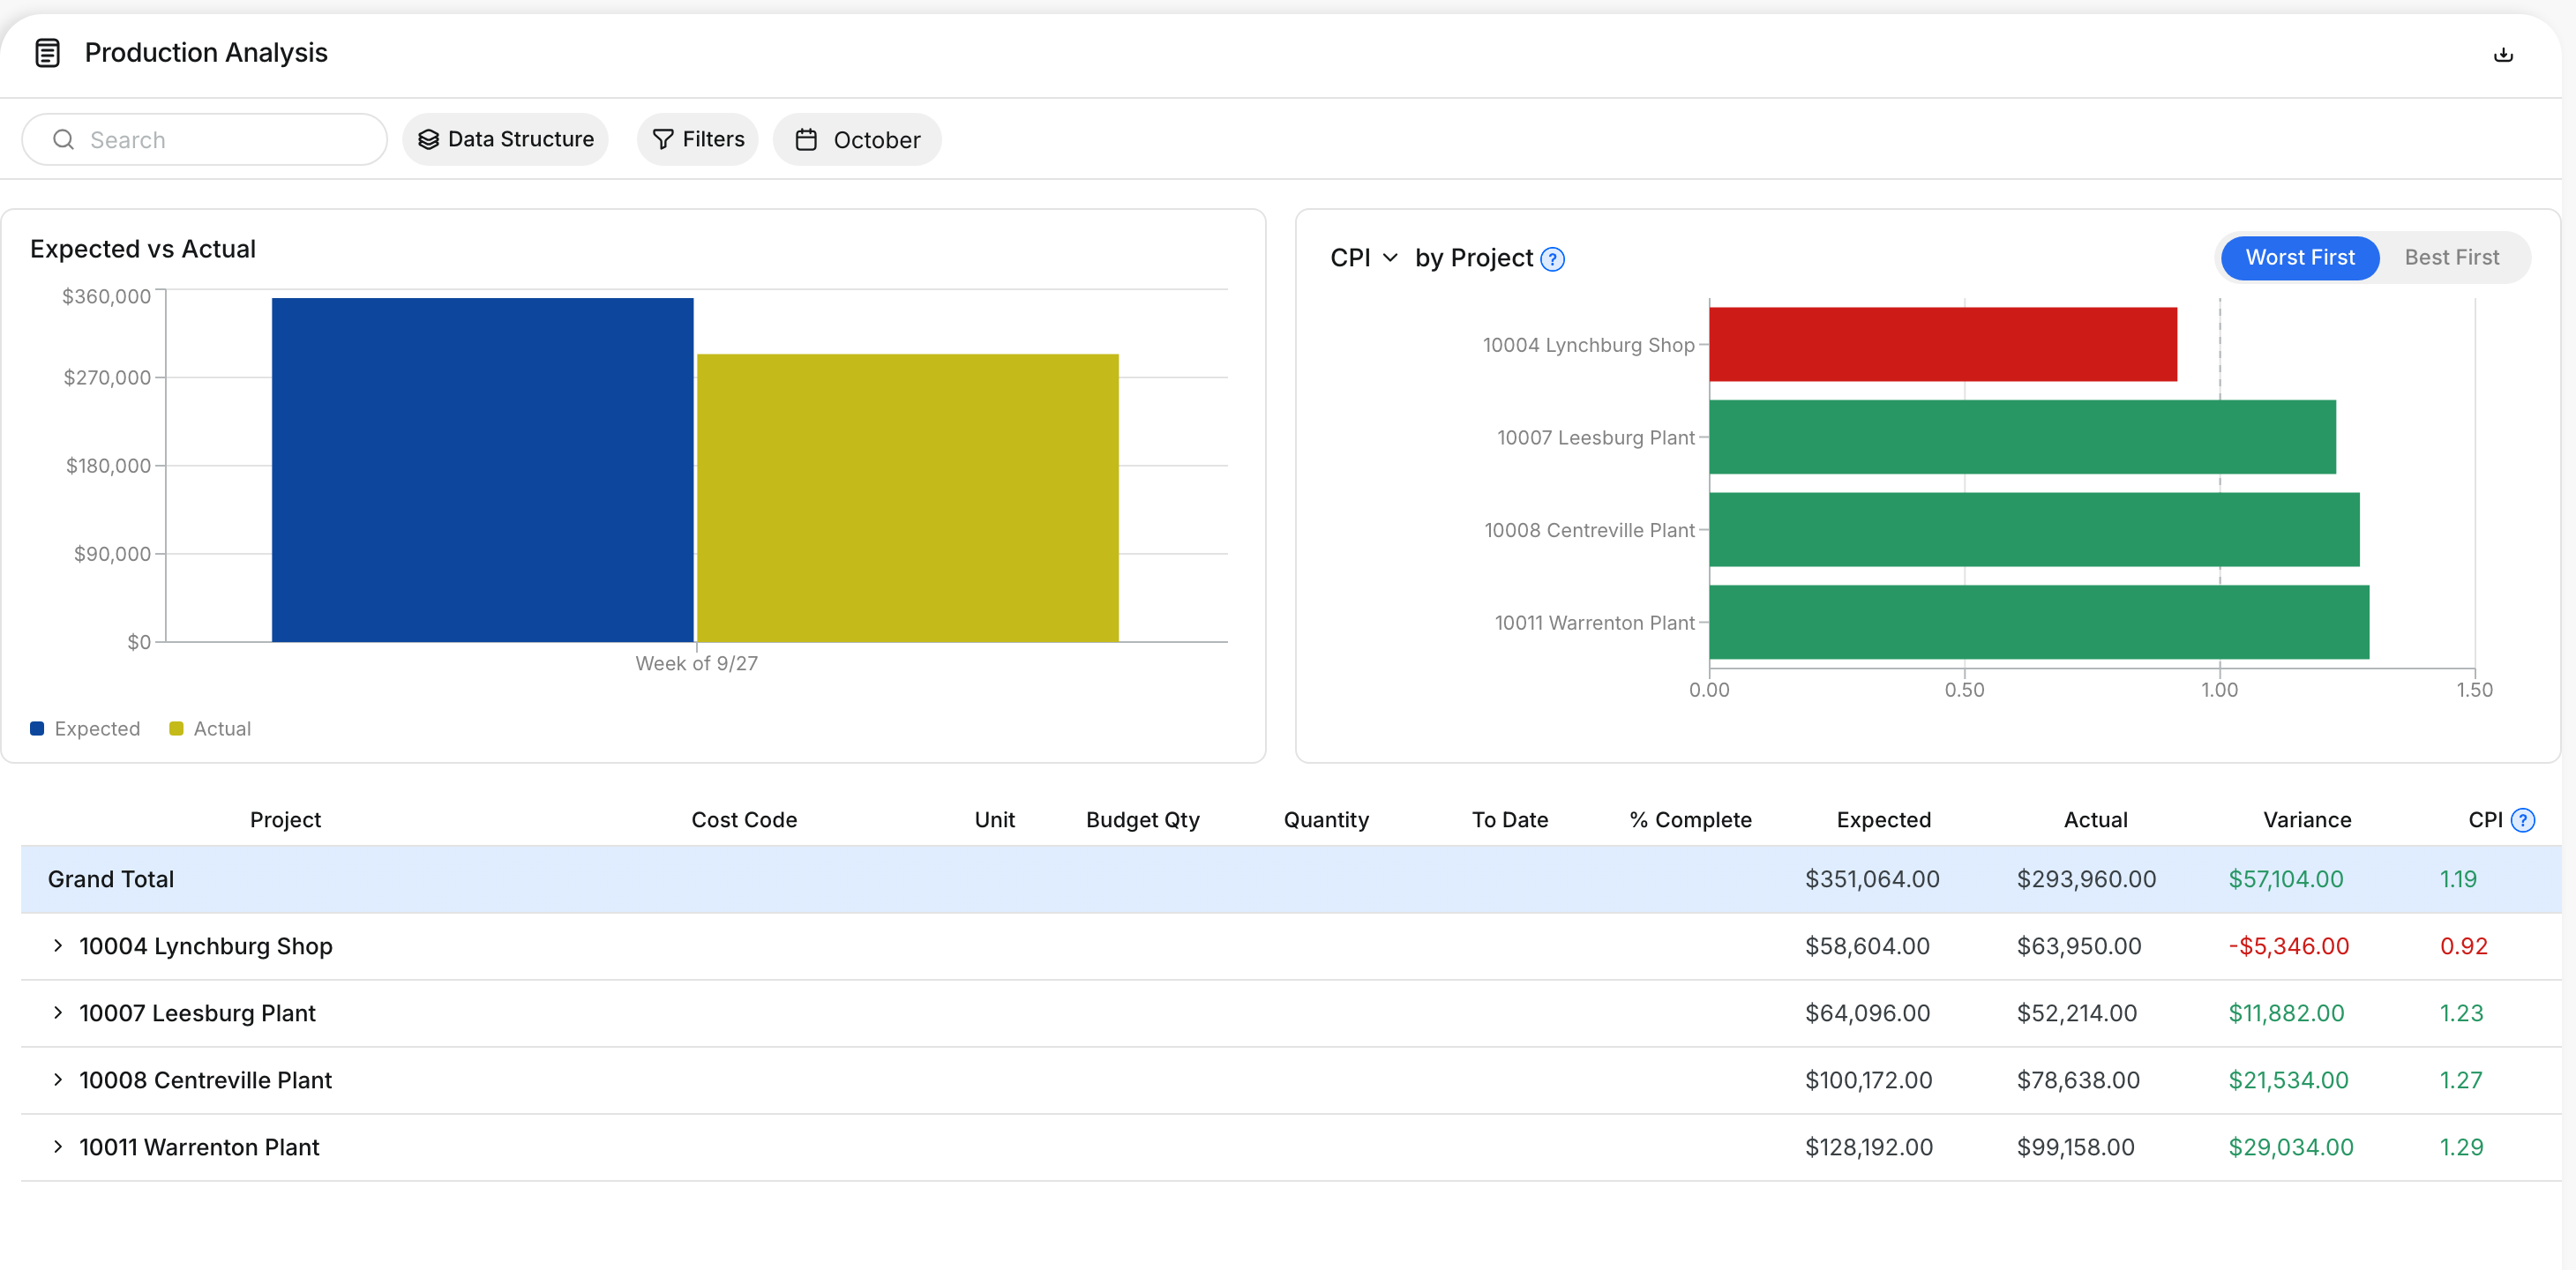
Go to Insights > Reports > Production Analysis. Pick the dates with the date chip, for example October.
Step 2: Choose how to group the numbers
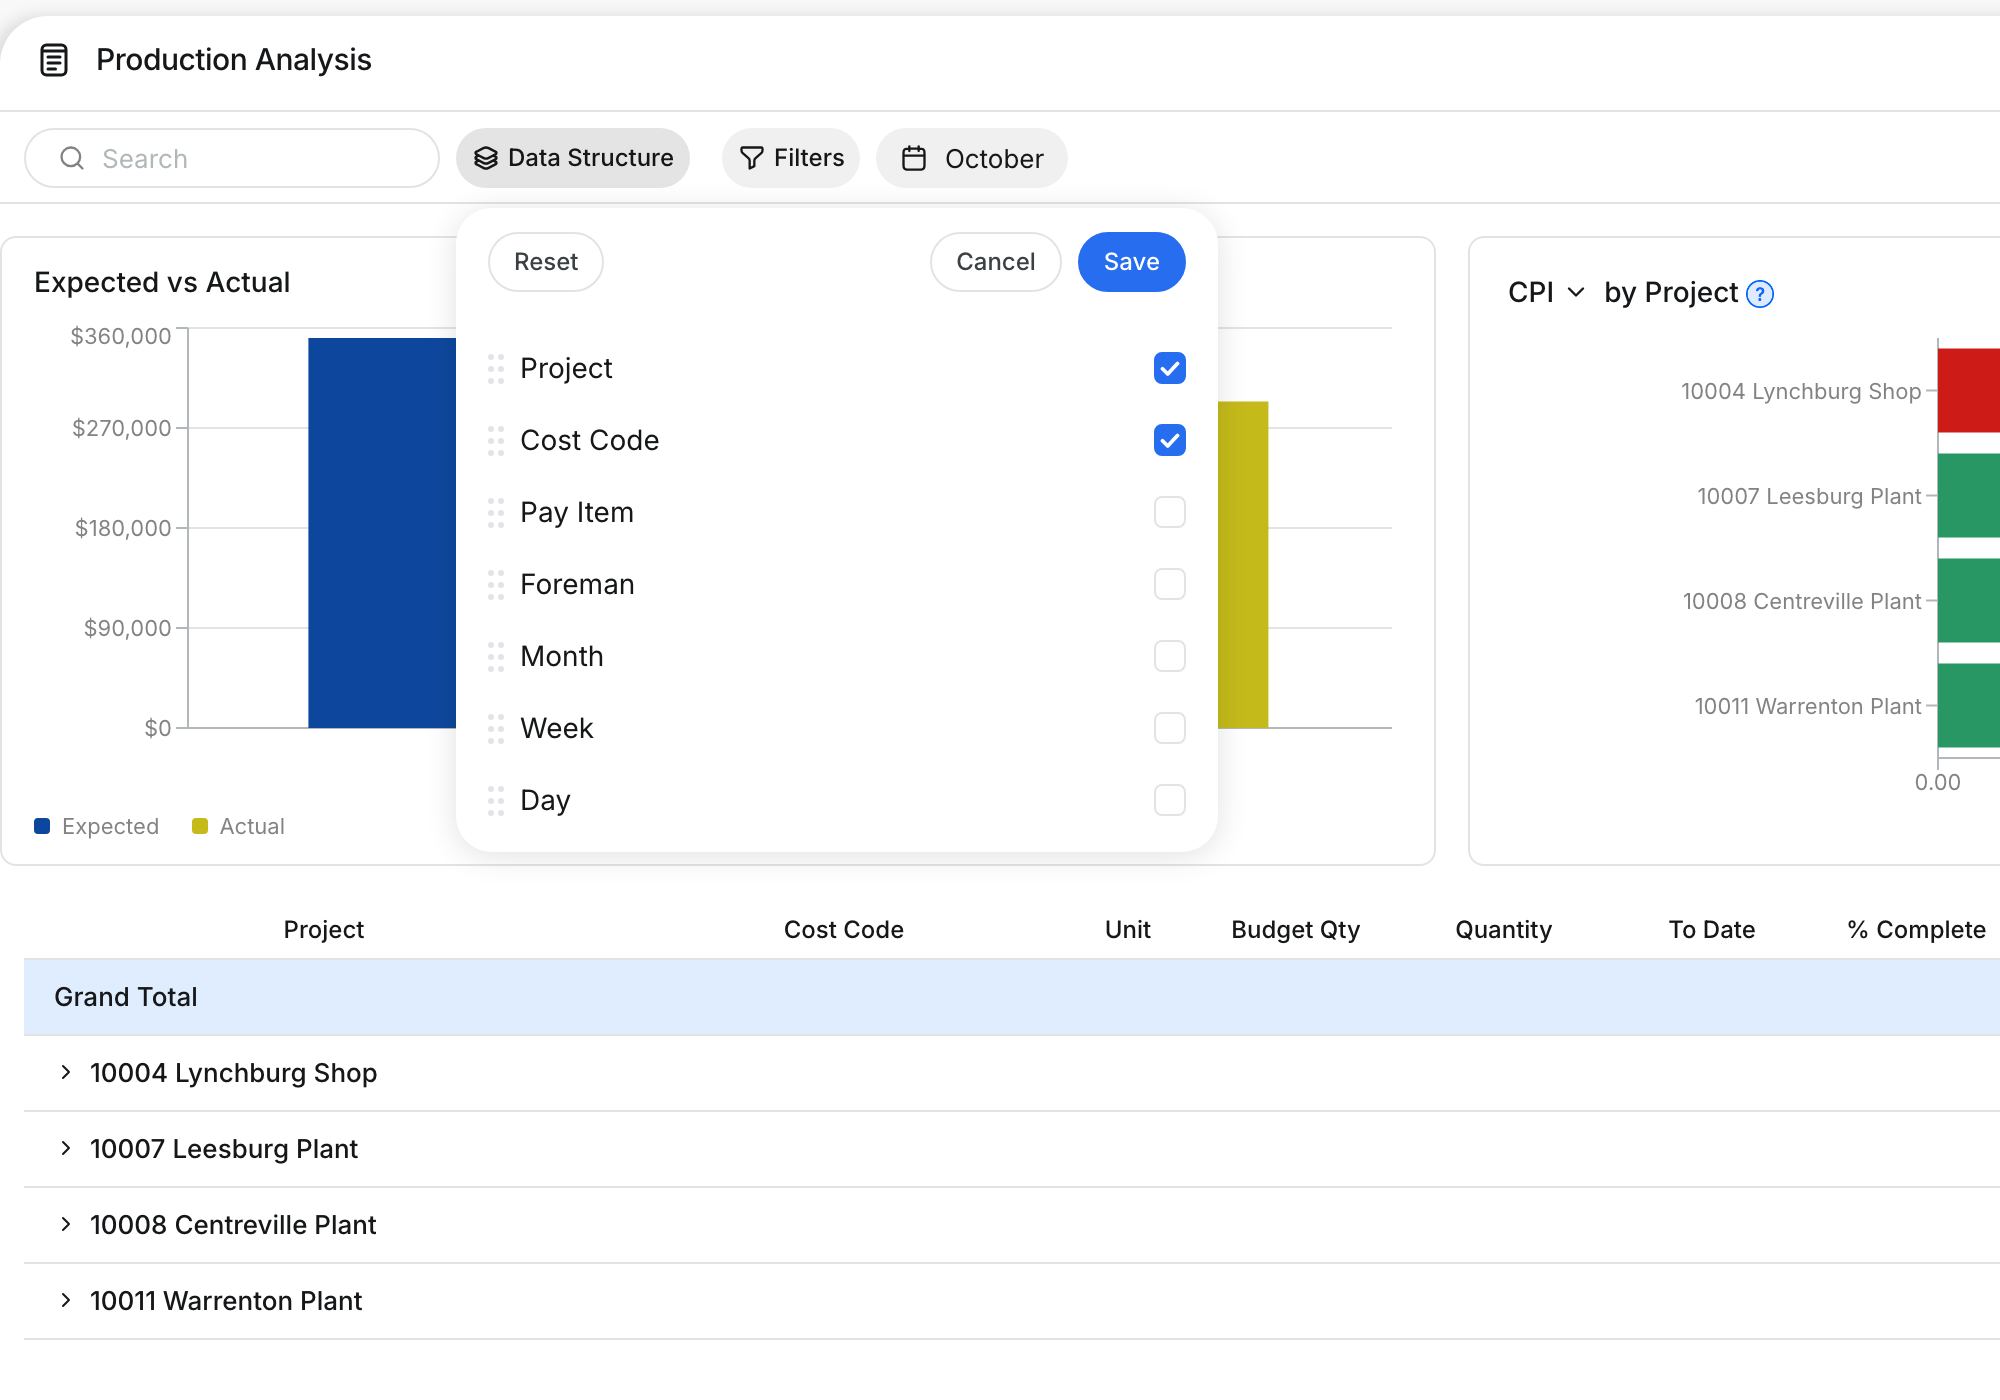
Click Data Structure. Check the levels you want: Project, Cost Code, Pay Item, Foreman, Month, Week or Day. Drag a level to change its order, then click Save.
Step 3: Filter the report
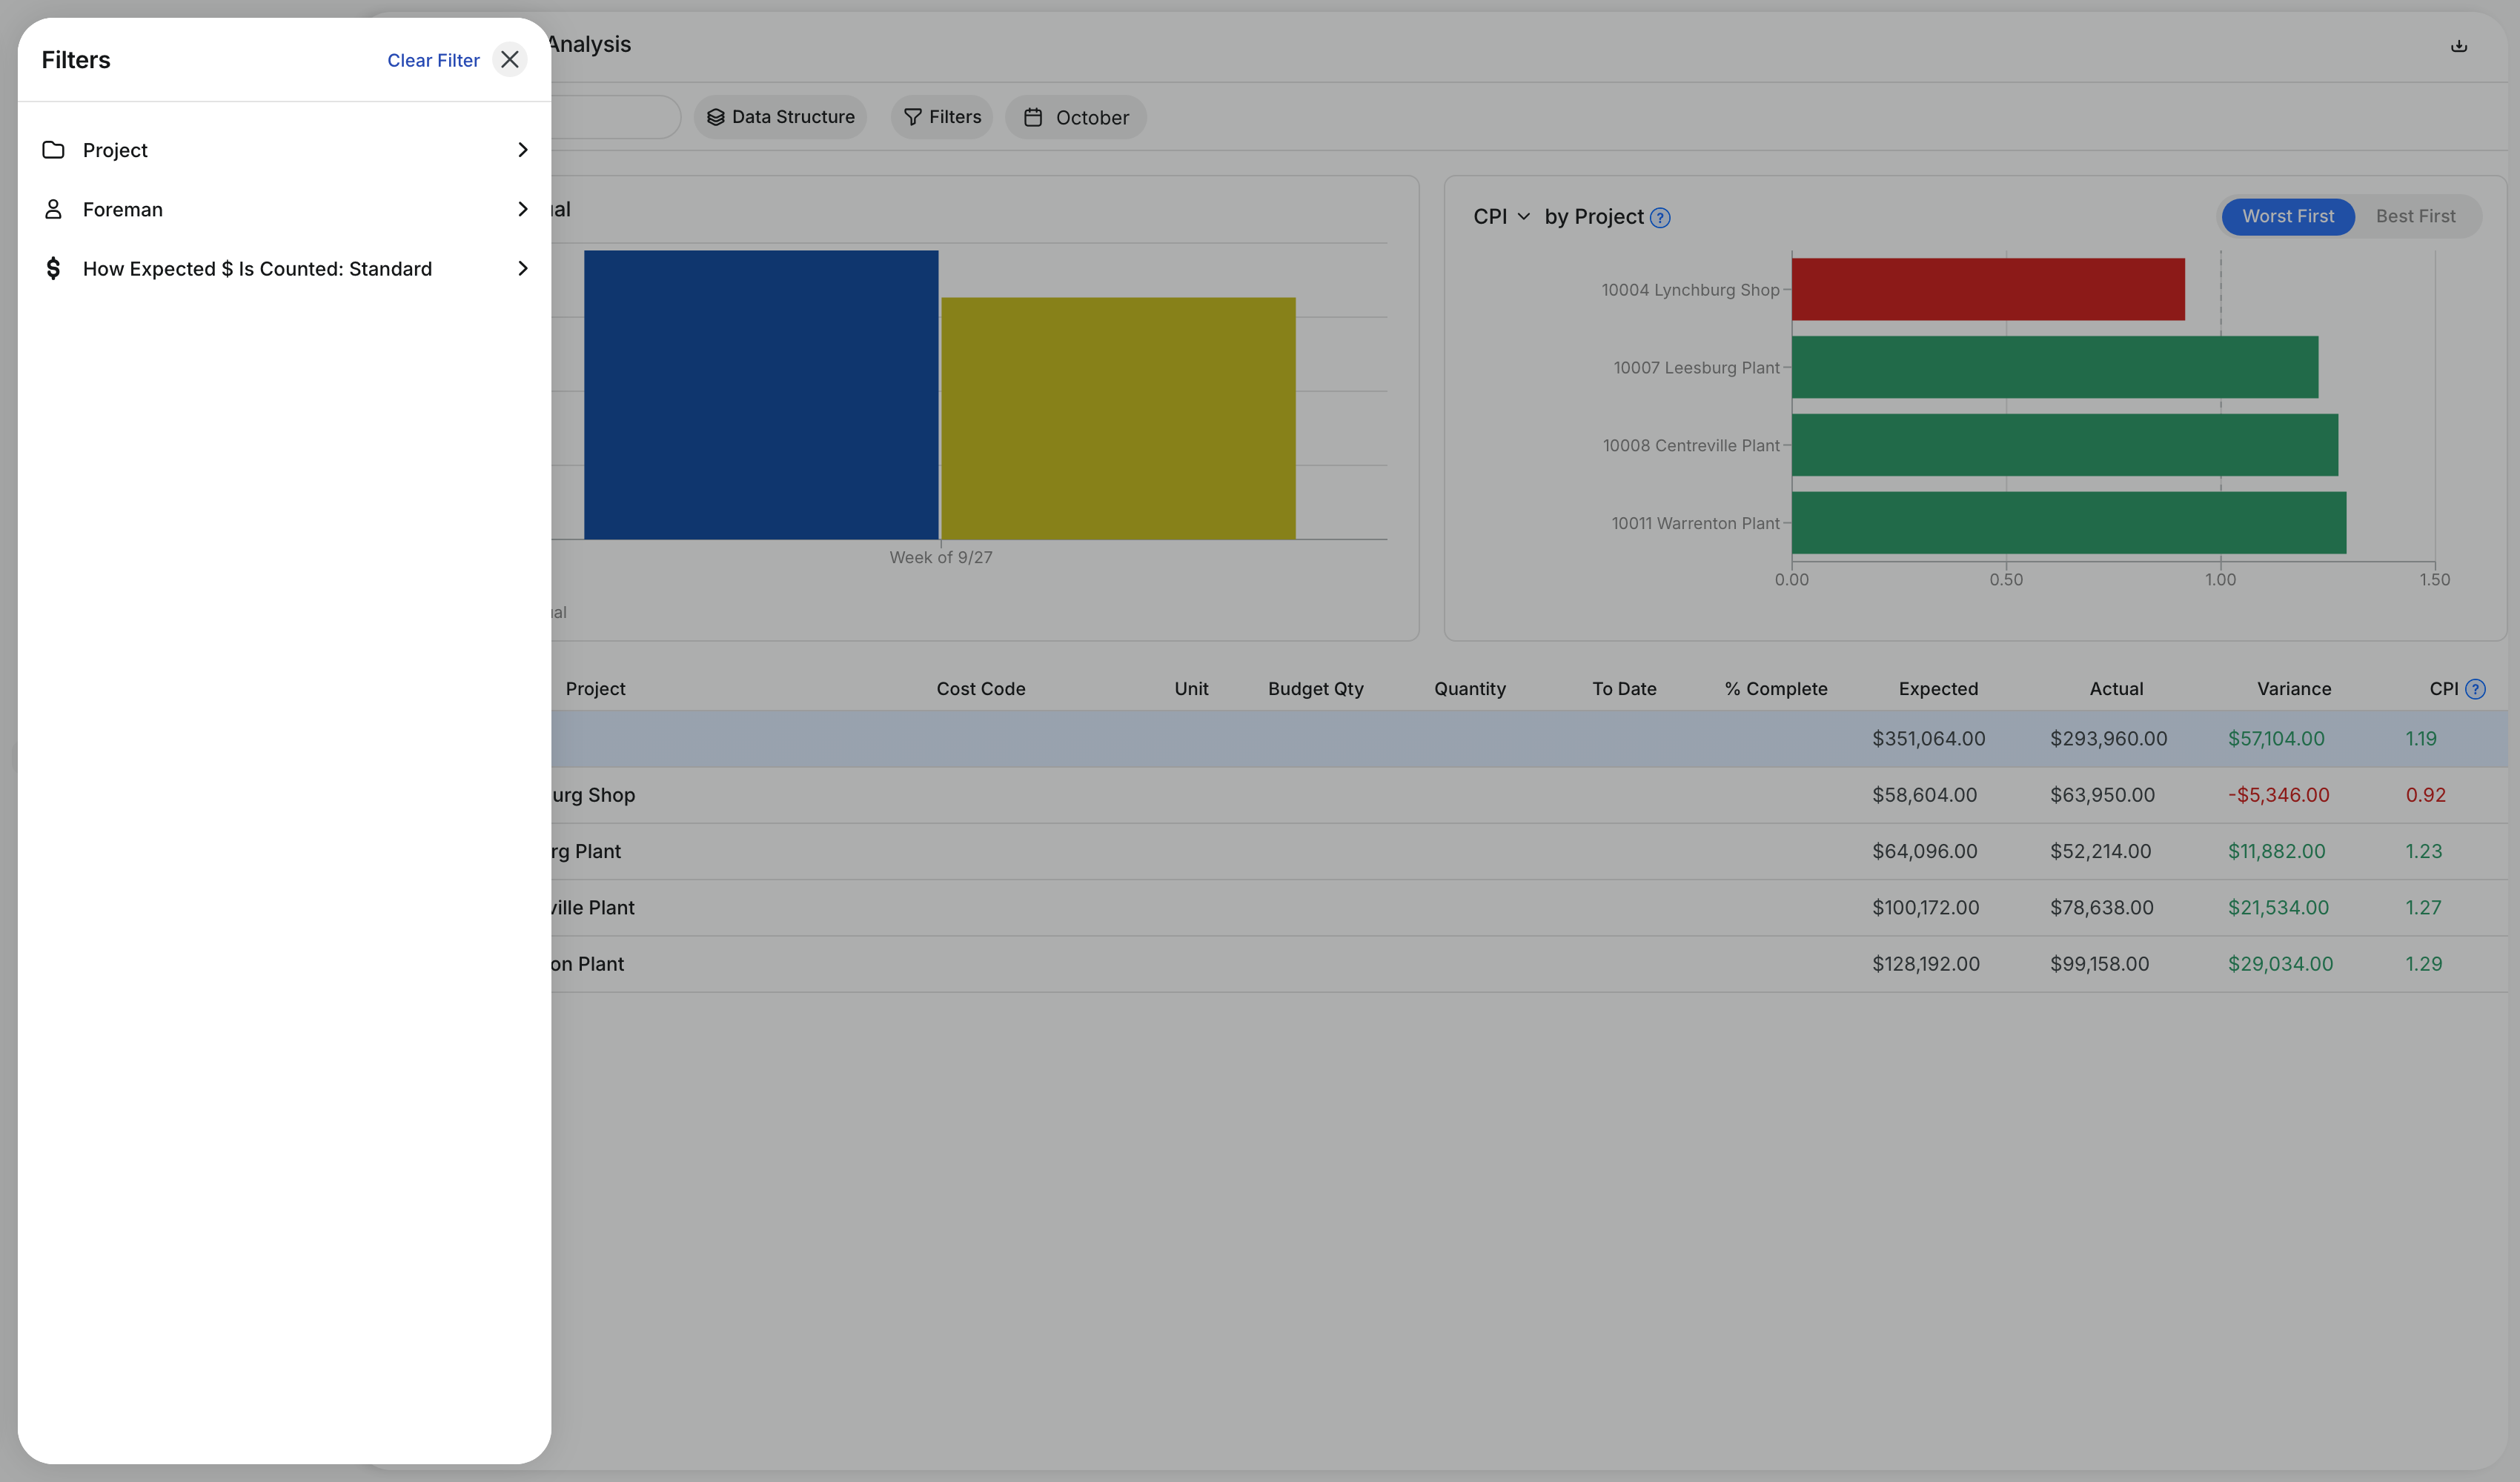
Click Filters to narrow the report by Project or Foreman. Use How Expected $ Is Counted to pick Standard or Lump Sum.
Step 4: Read the charts
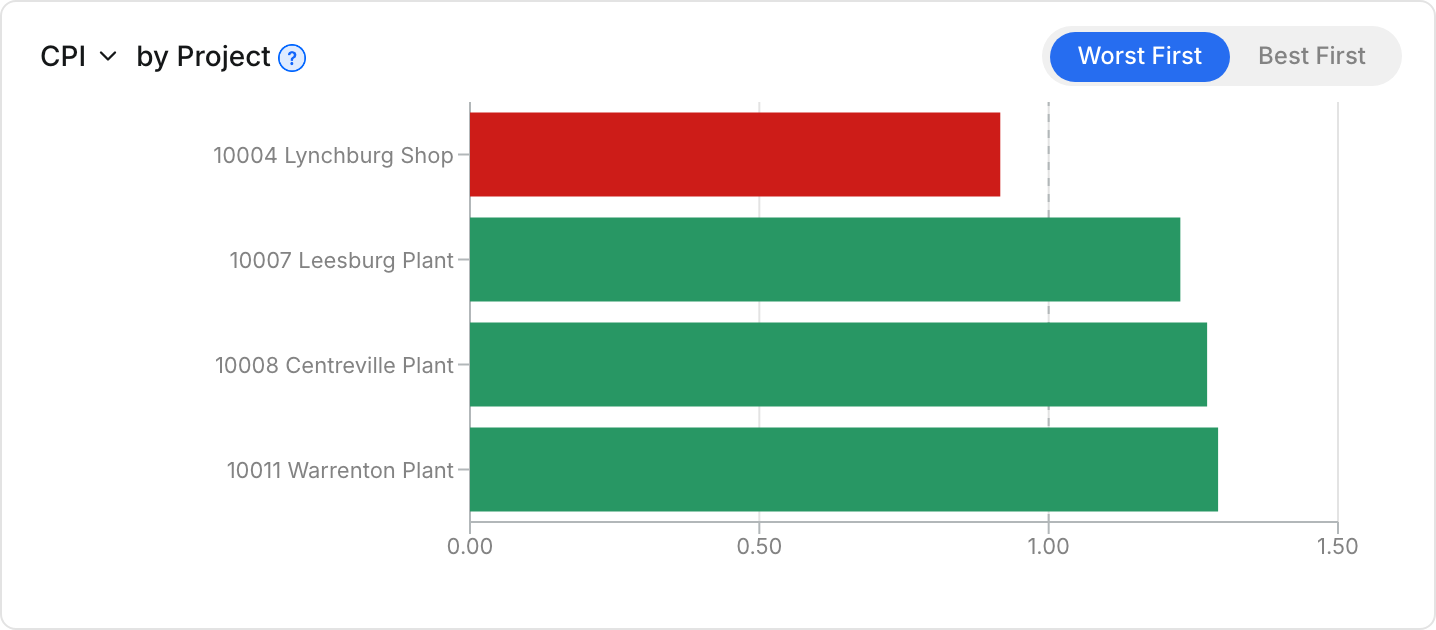
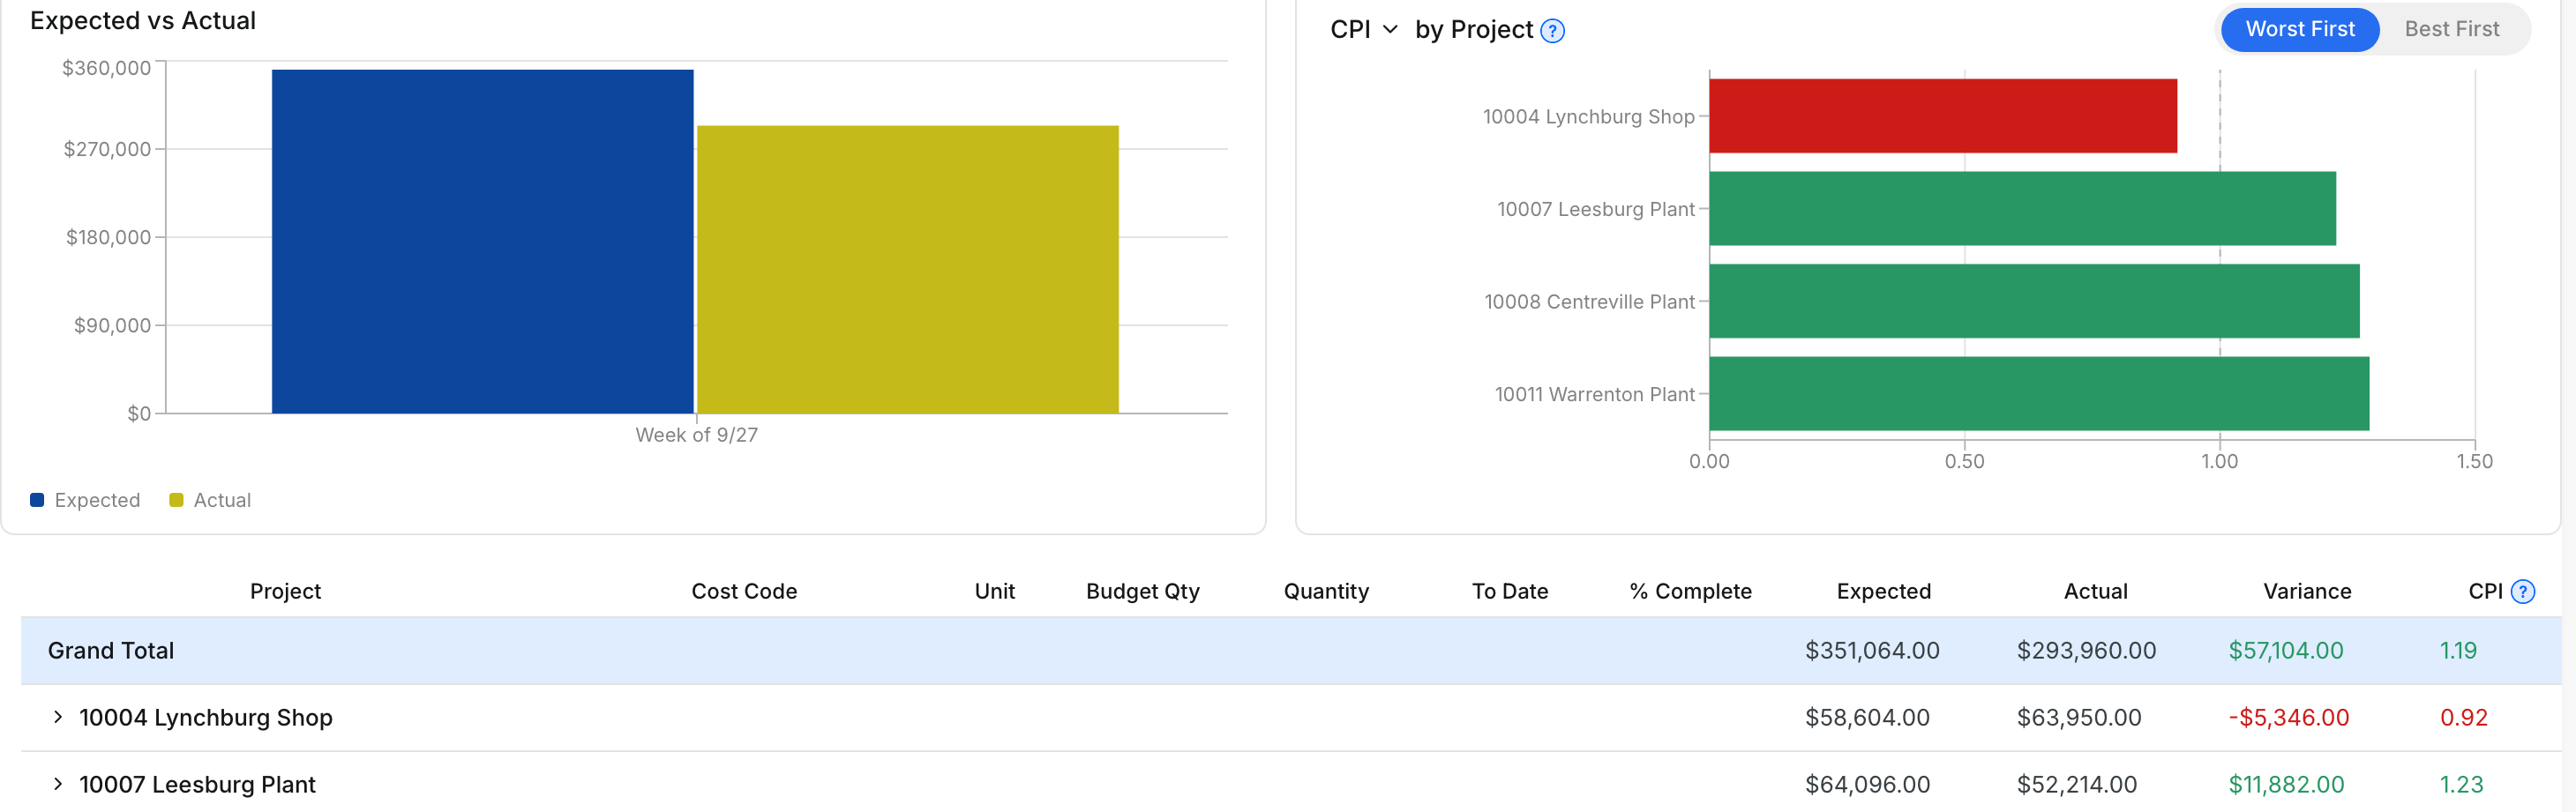
Expected vs Actual shows expected and actual dollars for each period. The CPI chart ranks the first level of your Data Structure, from worst to best.
Step 5: Open a row in the table
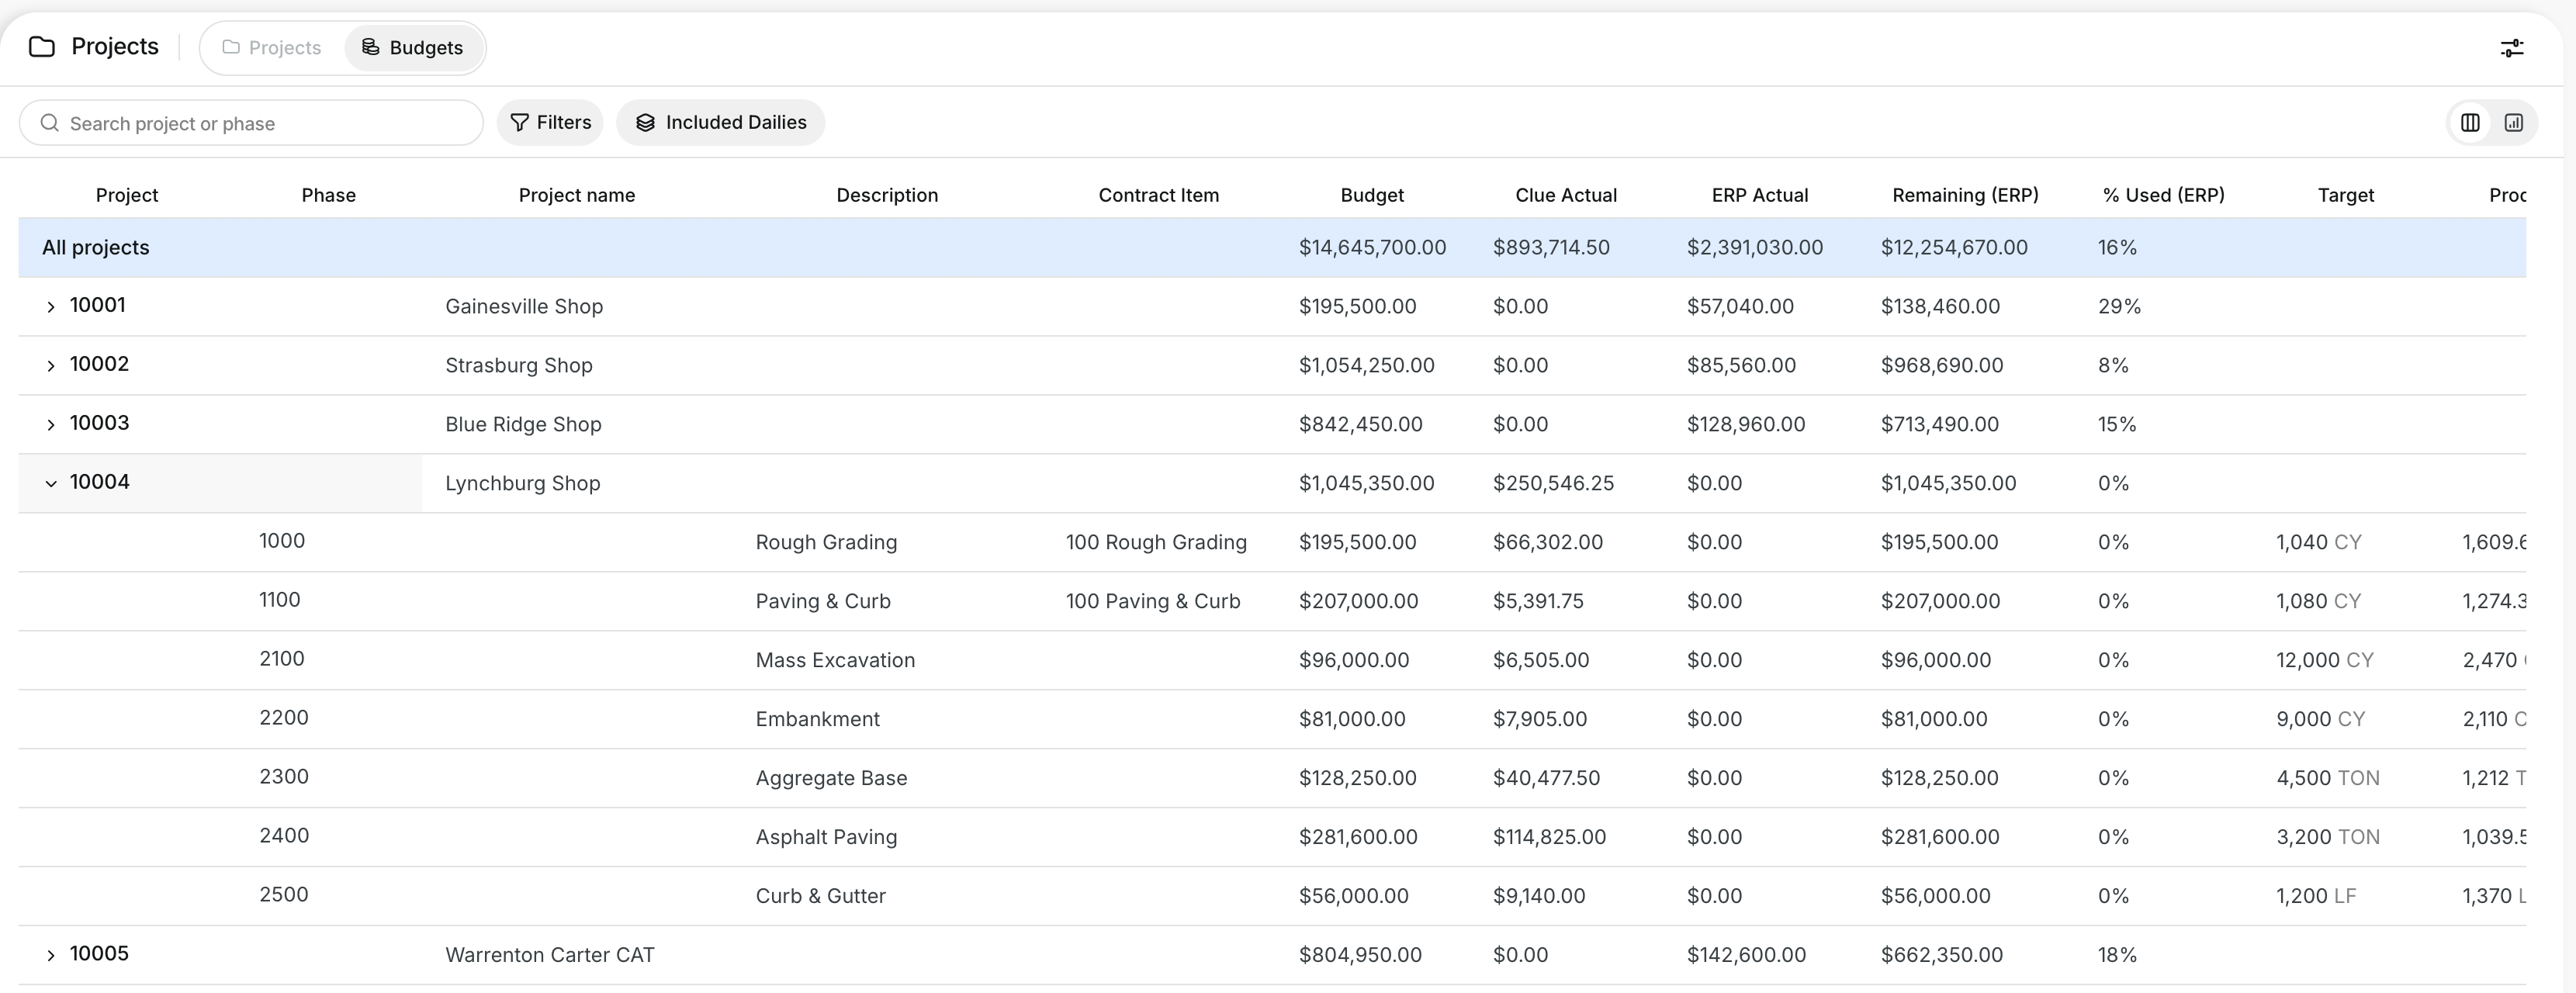
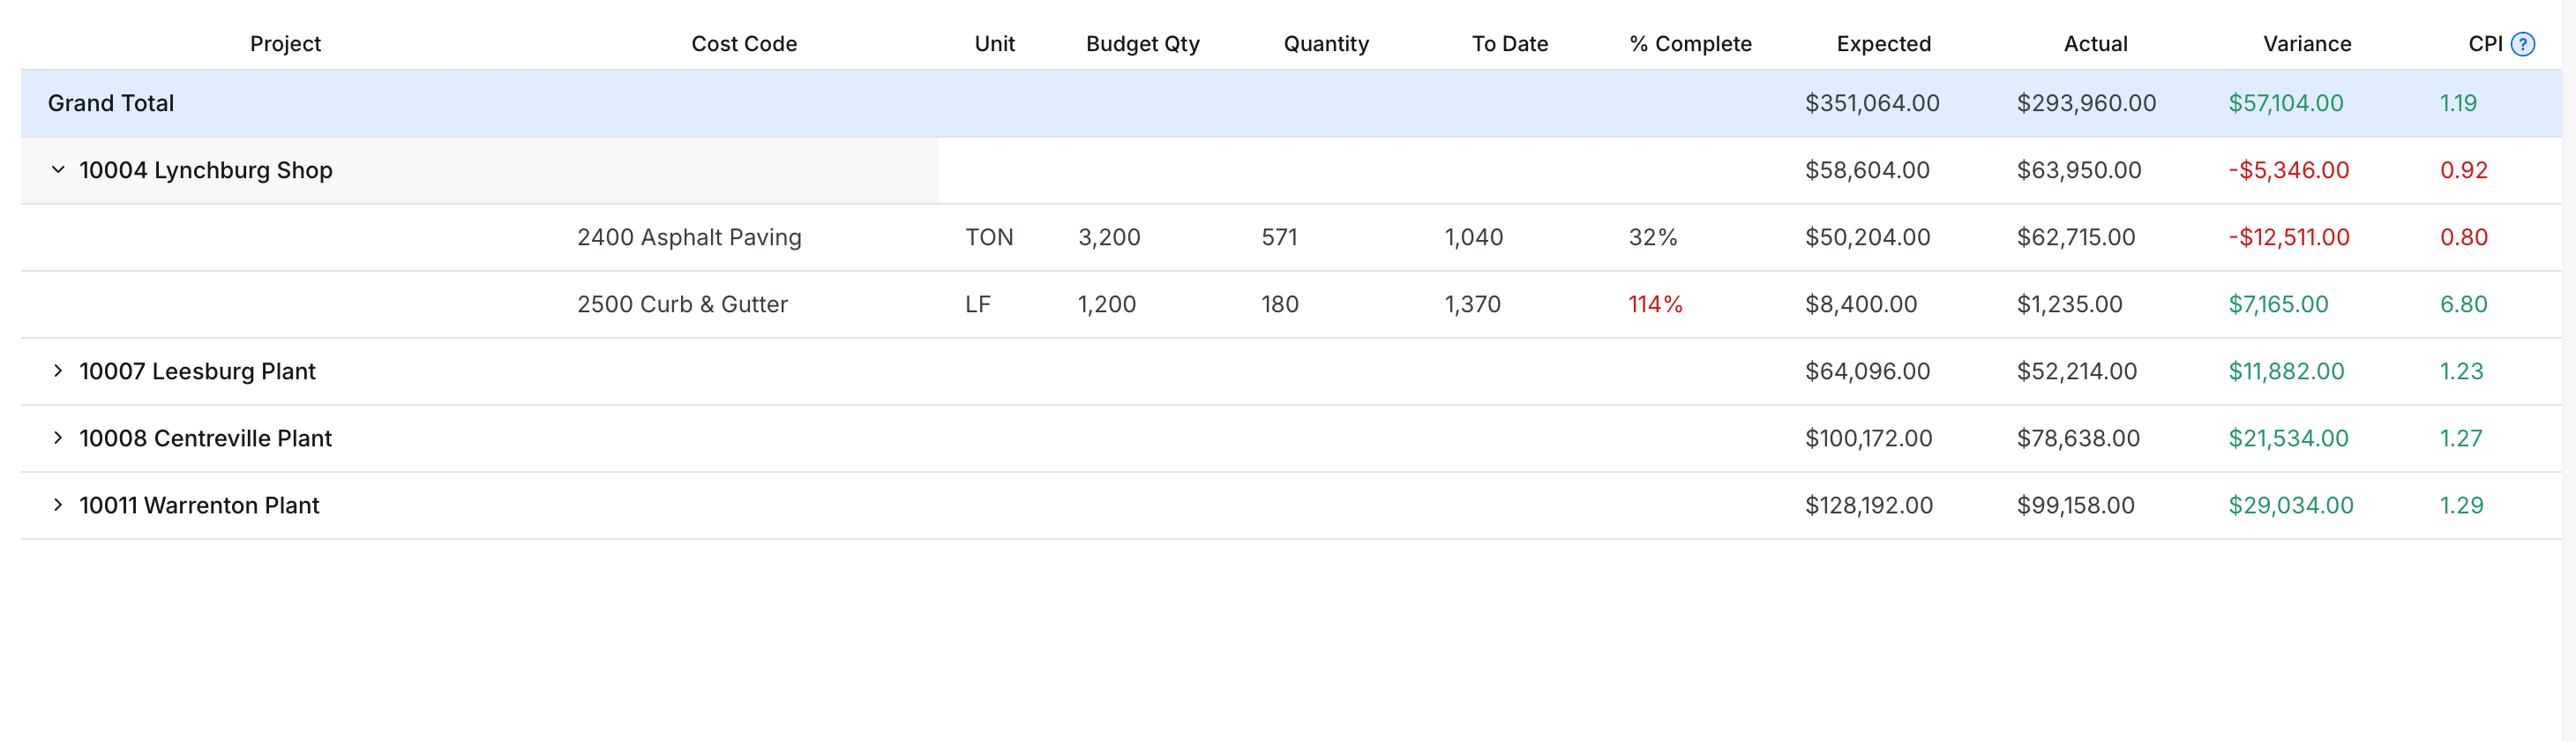
Click the arrow beside a project to see its cost codes. Each row shows quantities, dollars, Variance and CPI.
The full details
- Unit: the unit of measure for the cost code, for example CY, TON or LF.
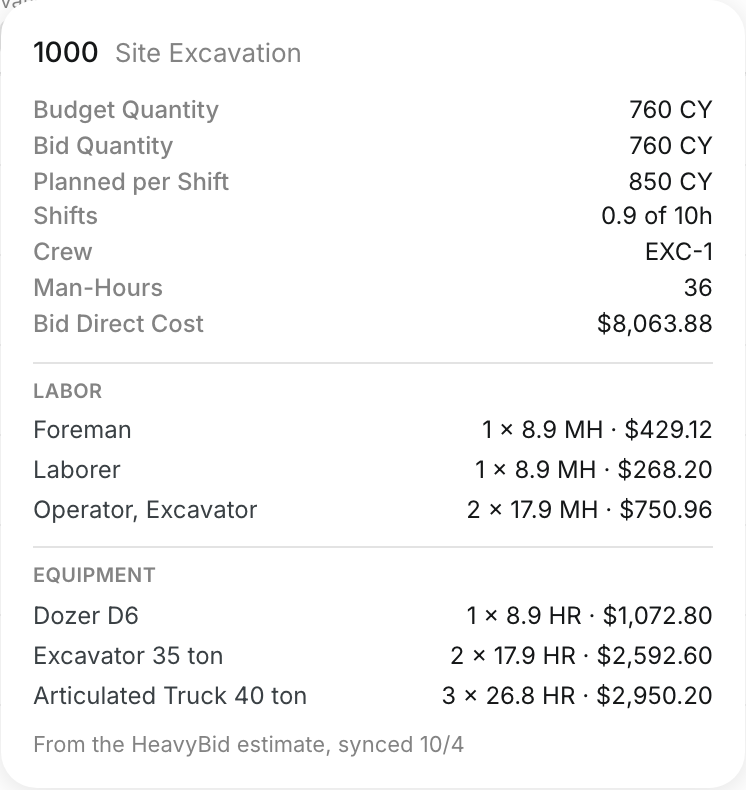
- Budget Qty: the quantity the budget plans for the cost code.
- Quantity: the quantity reported in dailies for the dates you picked.
- To Date: the total quantity reported so far.
- % Complete: the share of the budget quantity that is built.
- Expected: what the work done is worth at the budget rate.
- Actual: what the work cost, from the dailies.
- Variance: Expected minus Actual. Green is under budget, red is over budget.
- CPI: Expected divided by Actual. Green at 1.00 or more, red below 1.00.
- Standard: every unit installed earns its budget rate.
- Lump Sum: a cost code stops earning once its budget is used up.
- Grand Total: the totals for everything in the report.
- Quantity Produced: people who cannot see costs get this chart instead of Expected vs Actual.
- Download: click the download icon at the top right and choose .xls or .csv.
Tips
- Put Foreman first in the Data Structure to rank foremen in the CPI chart.
- Use Search to find a project or cost code fast.
- Download the data to share it with your office or your accounting team.