KPIs and Targets
Available now on Beta, This feature is in beta testing and will roll out to everyone soon.
What is this?
KPIs show how well a project performs in a shift. Each KPI is a widget on the project page. Targets tell Clue what a good shift looks like for each truck. Clue then shows if you are above or below the target.
Who's this for?
- Project managers, track cost and output against the plan.
- Superintendents, set daily targets for each truck.
- Estimators, compare real cost per unit with the bid.
How to use it
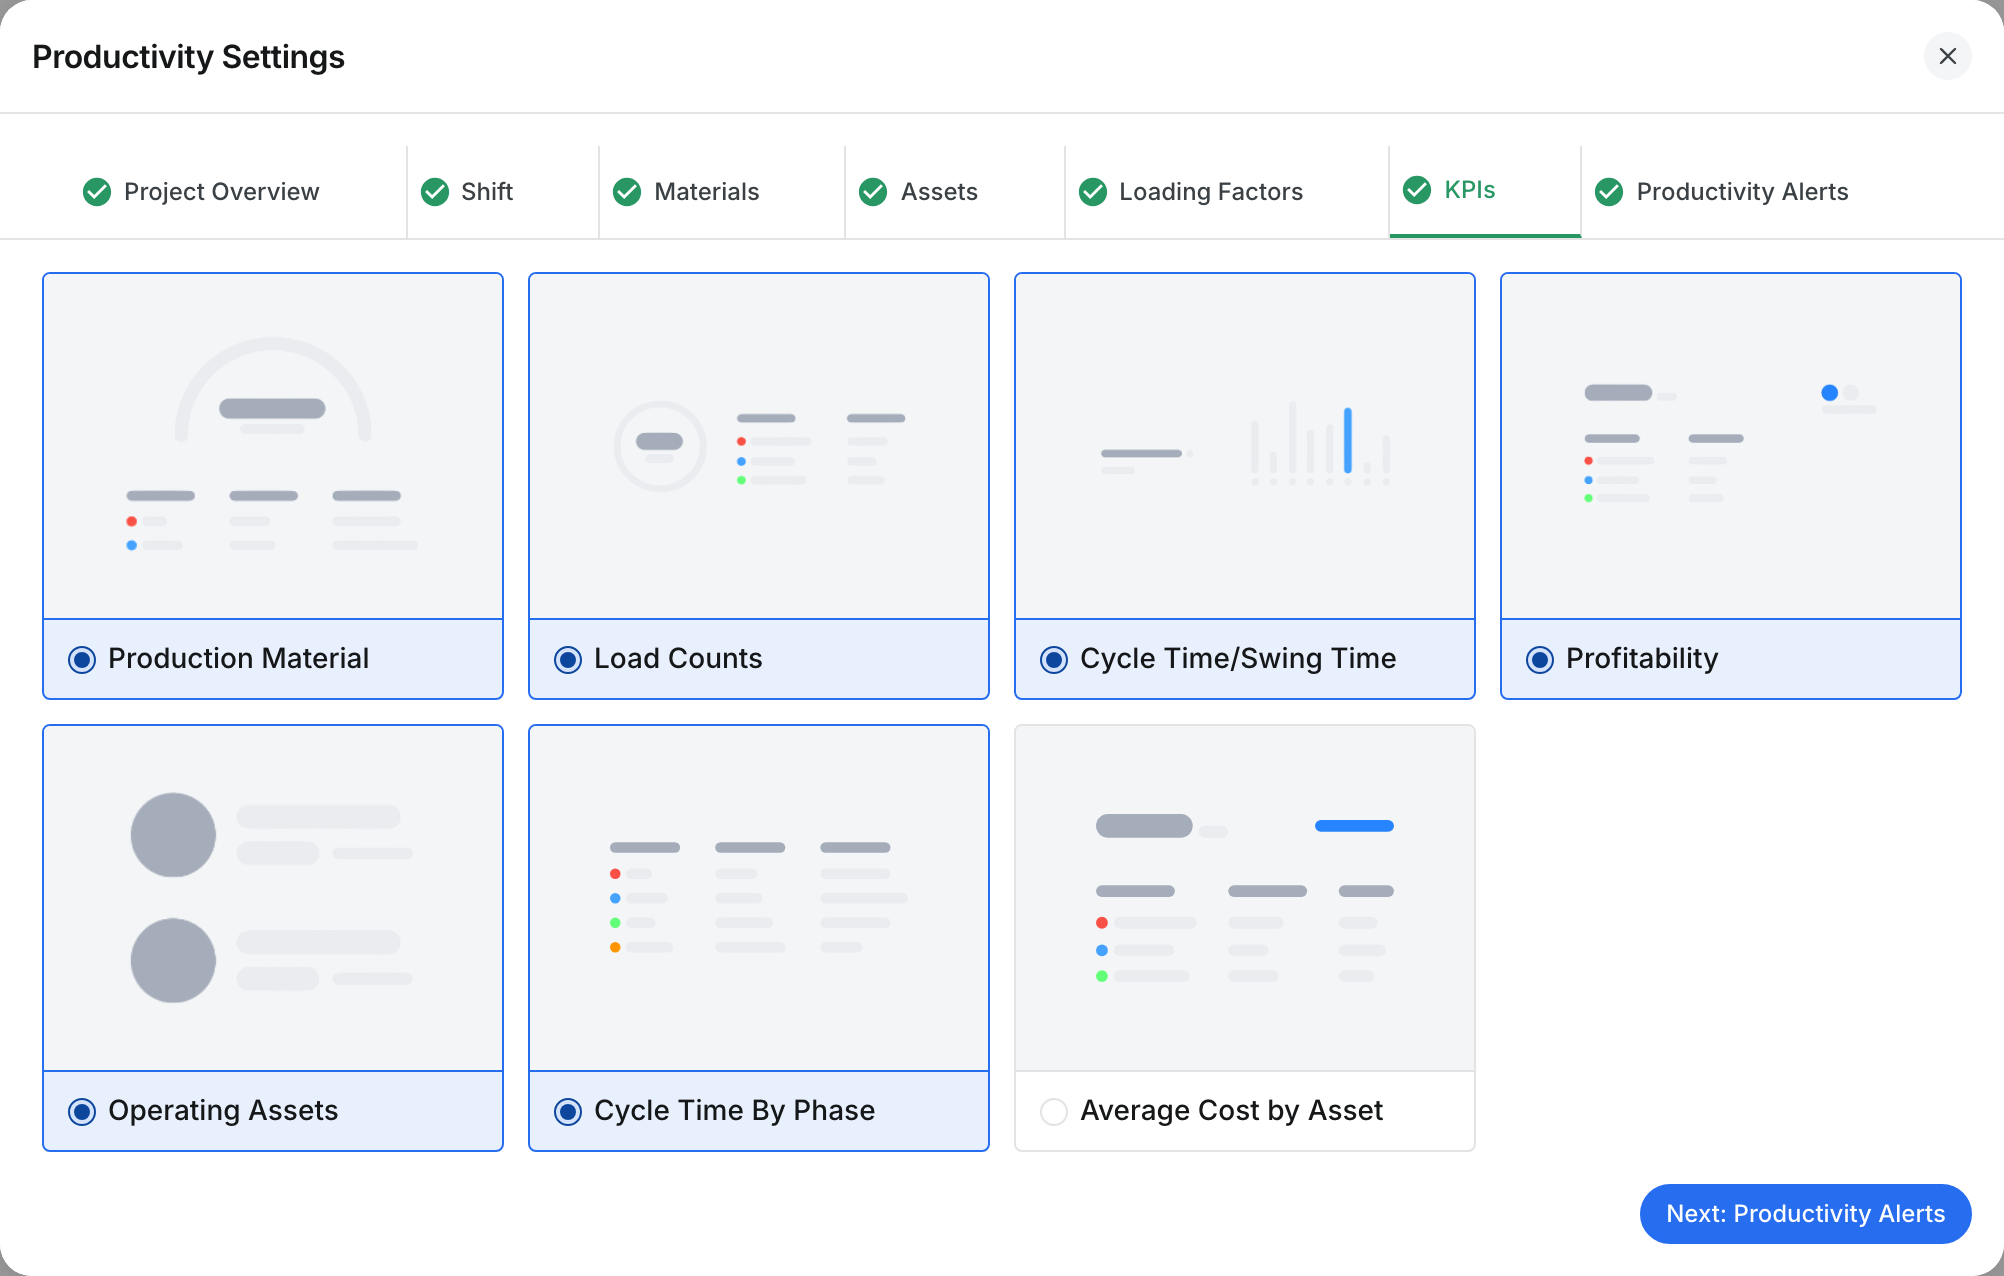
Step 1: Turn on the KPI widgets
Open a project in Operations > Production. Click Productivity Settings > KPIs. Select the widgets you want to see.
Step 2: Read cycle and swing time
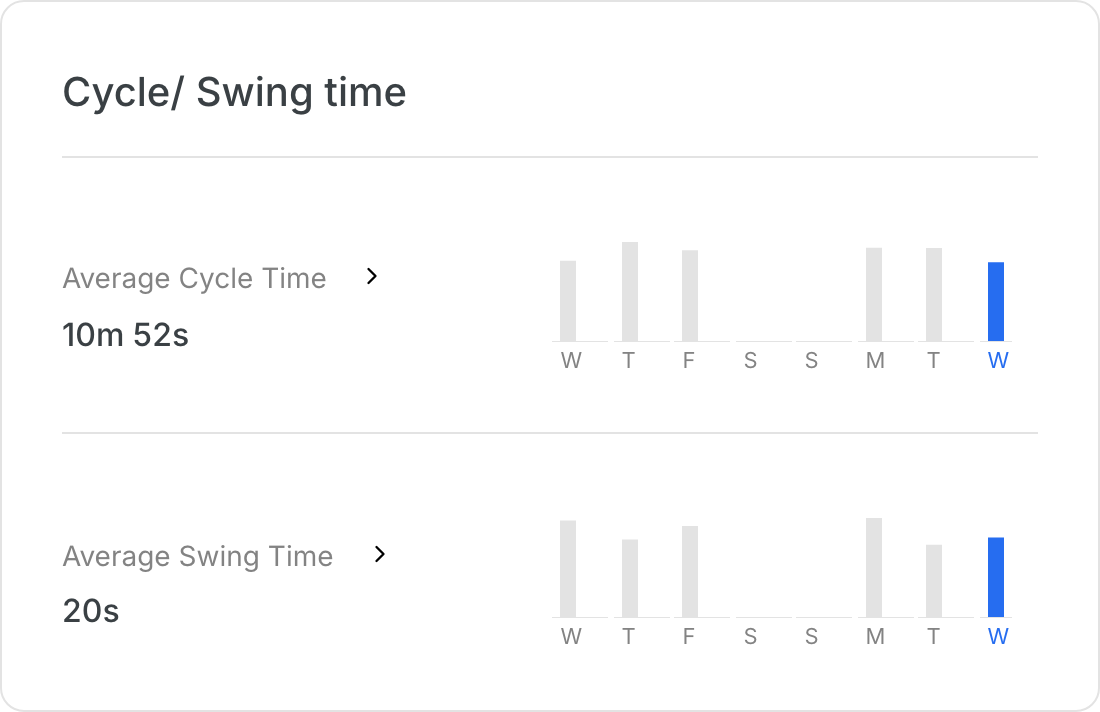
Cycle/ Swing time shows the Average Cycle Time and the Average Swing Time. The bars show the last days.
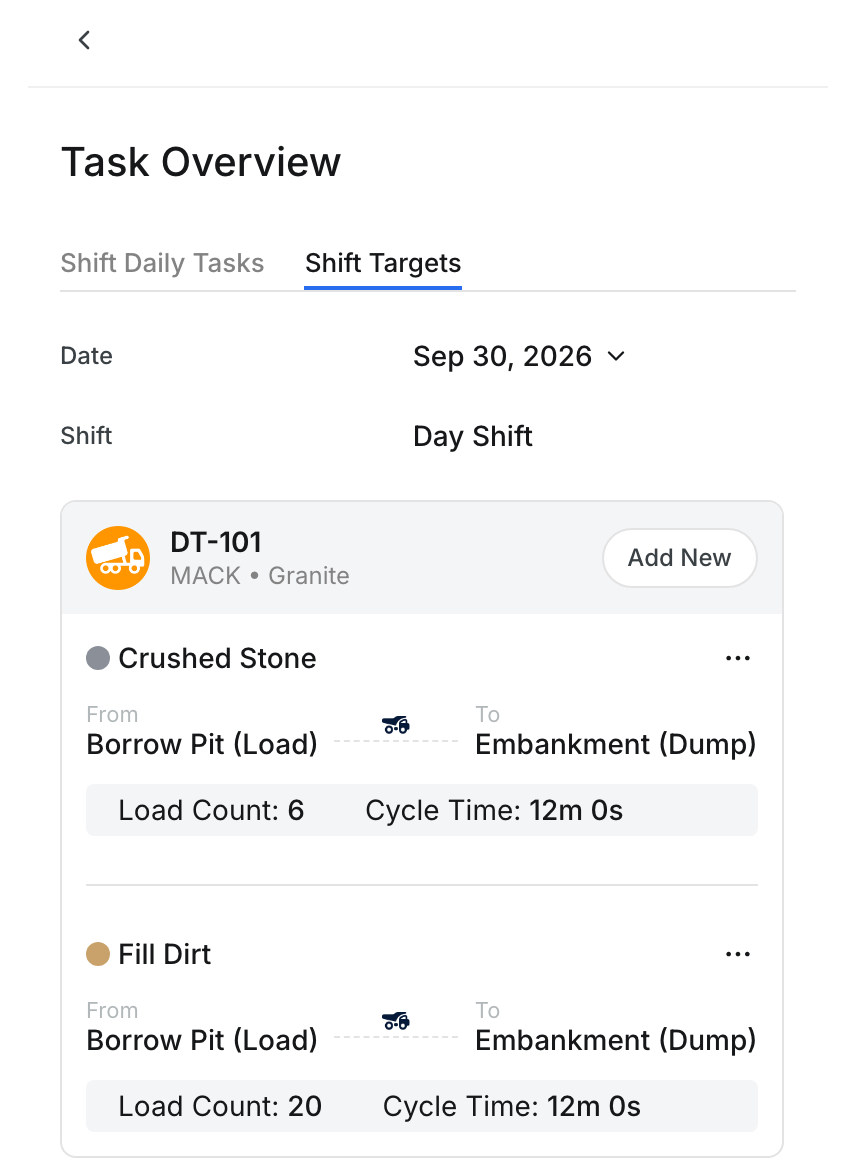
Step 3: Open the shift targets
Click Daily Tasks, then Shift Targets. Each truck shows its target Load Count and Cycle Time for each task.
Step 4: Add a target
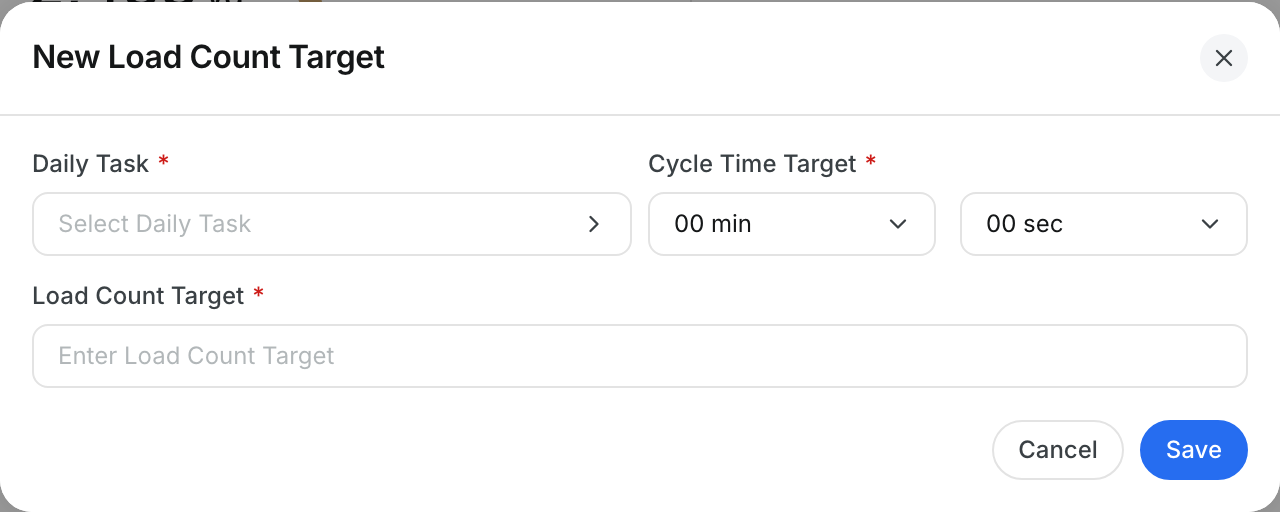
Click Add New on a truck. Pick the Daily Task. Enter the Cycle Time Target and the Load Count Target. Click Save, or Cancel to close.
The full details
- Production by Material: Total volume, and the volume and percent for each material.
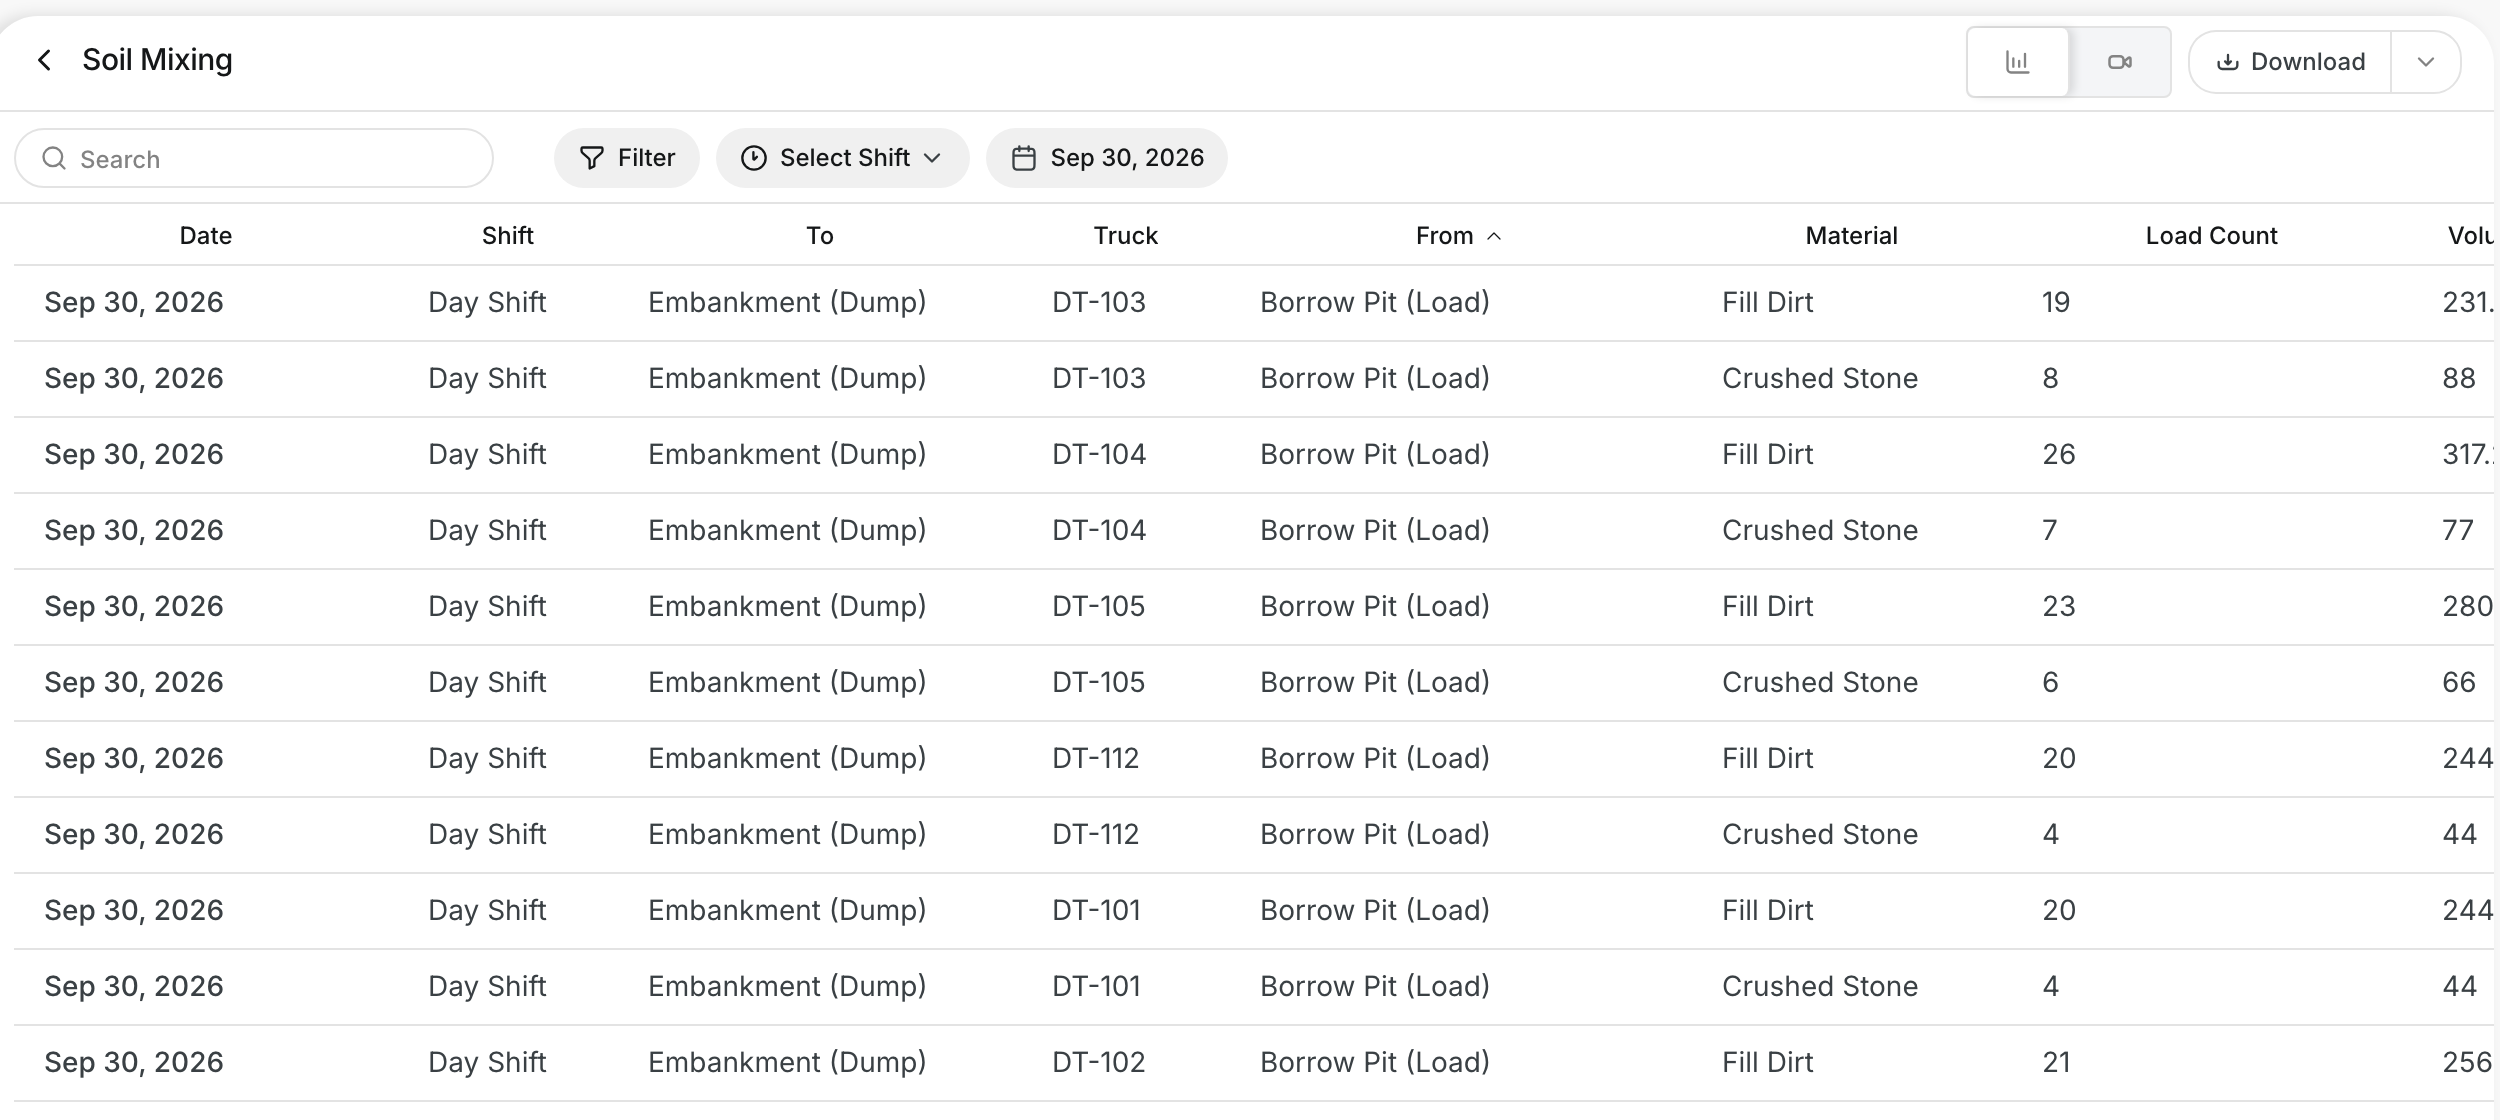
- Load Count: Total loads, and the loads for each material.
- Average Cycle Time: The average time of one truck trip: load, haul, dump and return.
- Average Swing Time: The average time of one loader swing.
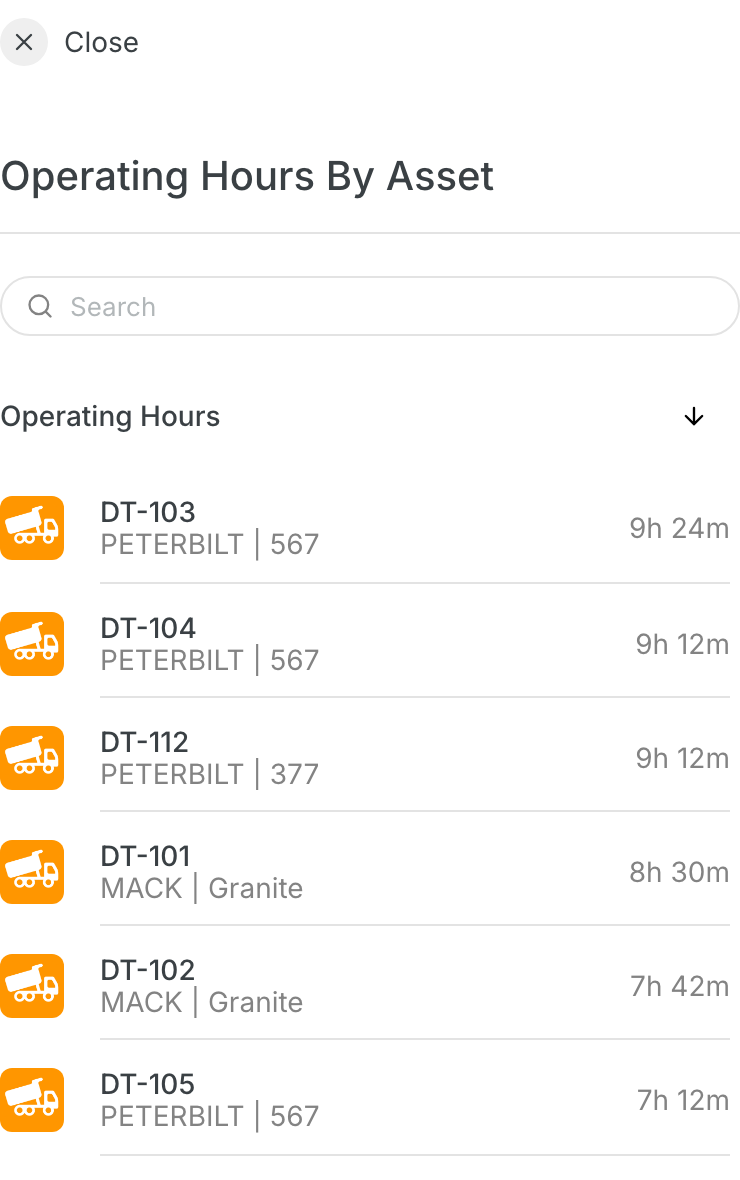
- Operating Asset: How many assets worked in the shift, out of the assets on the project.
- Cycle Time by Phase: The average time and percent for each phase of the trip, for example Load, Haul, Dump and Return.
- Average Cost: The average cost for each unit of volume, for example per yd³. Shown in the Profitability widget.
- Cost vs. target: The percent difference between the average cost and the target. A positive number shows Above Target. A negative number shows Below Target.
- Revenue Earned: The revenue for each unit of volume, for each material. It comes from the Revenue in Productivity Settings > Materials.
- Average Cost by Asset: The Role, Type, Total HRS, Hourly rate and Total Cost of each asset. Hourly comes from the Hourly Cost in Productivity Settings > Assets.
- Load Count Target: The planned number of loads for one truck on one task.
- Cycle Time Target: The planned time for one full trip.
Tips
- Click the arrow next to Average Cycle Time to see more detail.
- Keep the Hourly Cost of each asset current, so the cost numbers stay correct.
- Set the targets before the shift starts.