What is this?
The Fuel & Fluids report shows every fuel fill your crews log, day by day and asset by asset. It adds up primary fuel for each machine and can also show fluids like coolant, DEF and engine oil. If your fuelers run fuel truck shifts, you can compare what each truck dispensed with what was logged. You can also follow fuel from the truck that gave it to the machine that got it.
Who's this for?
- Equipment managers, see which machines took fuel and how much, every day.
- Fuel and lube leads, check that every fuel truck shift adds up and every fill is logged.
- Project managers and job cost, see fuel by project and send the numbers to accounting.
How to use it
Step 1: Open the report
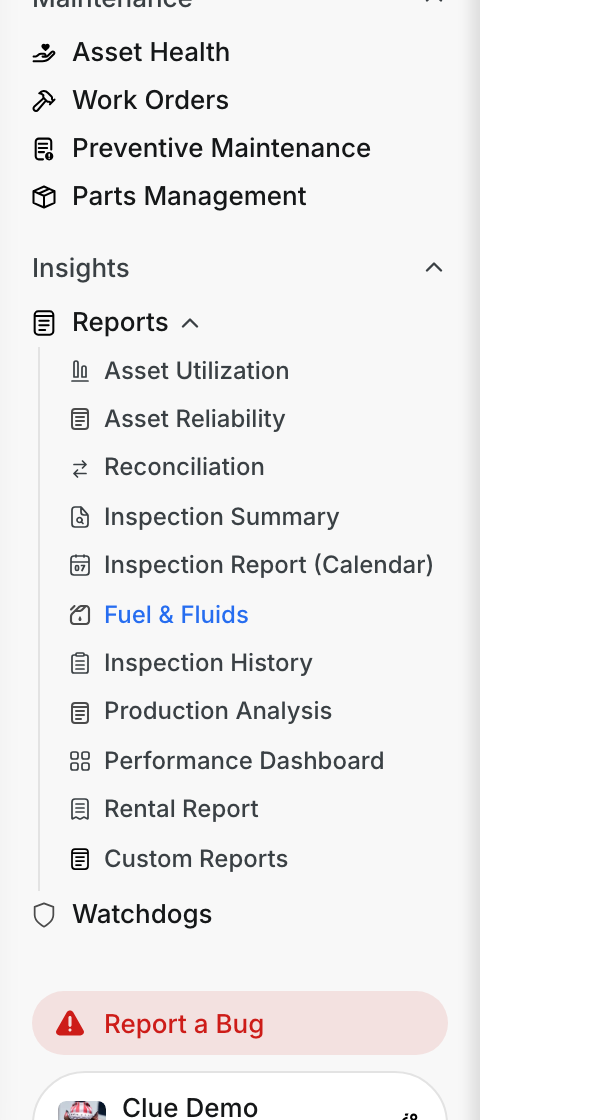
In the main menu, go to Insights > Reports and click Fuel & Fluids. The report opens on the By Asset tab.
Step 2: Pick the dates
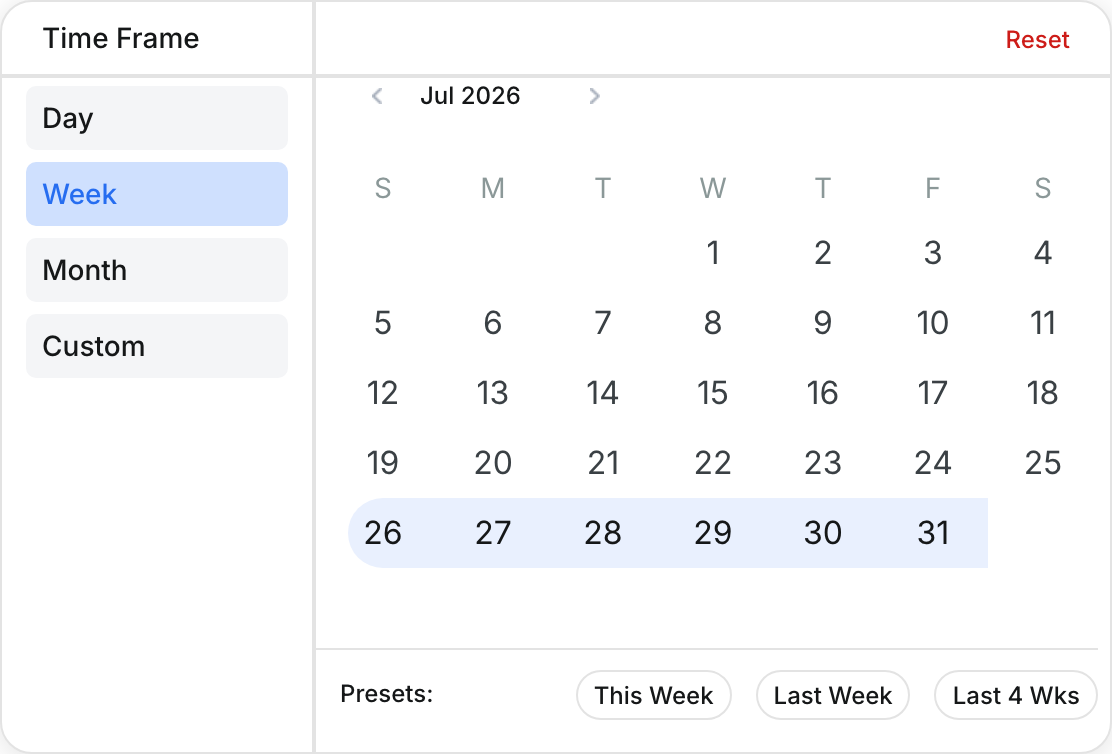
Click the date button. Choose Day, Week, Month or Custom, then pick the period. The report opens on the current week and shows up to 31 days at a time.
Step 3: Read fuel by asset
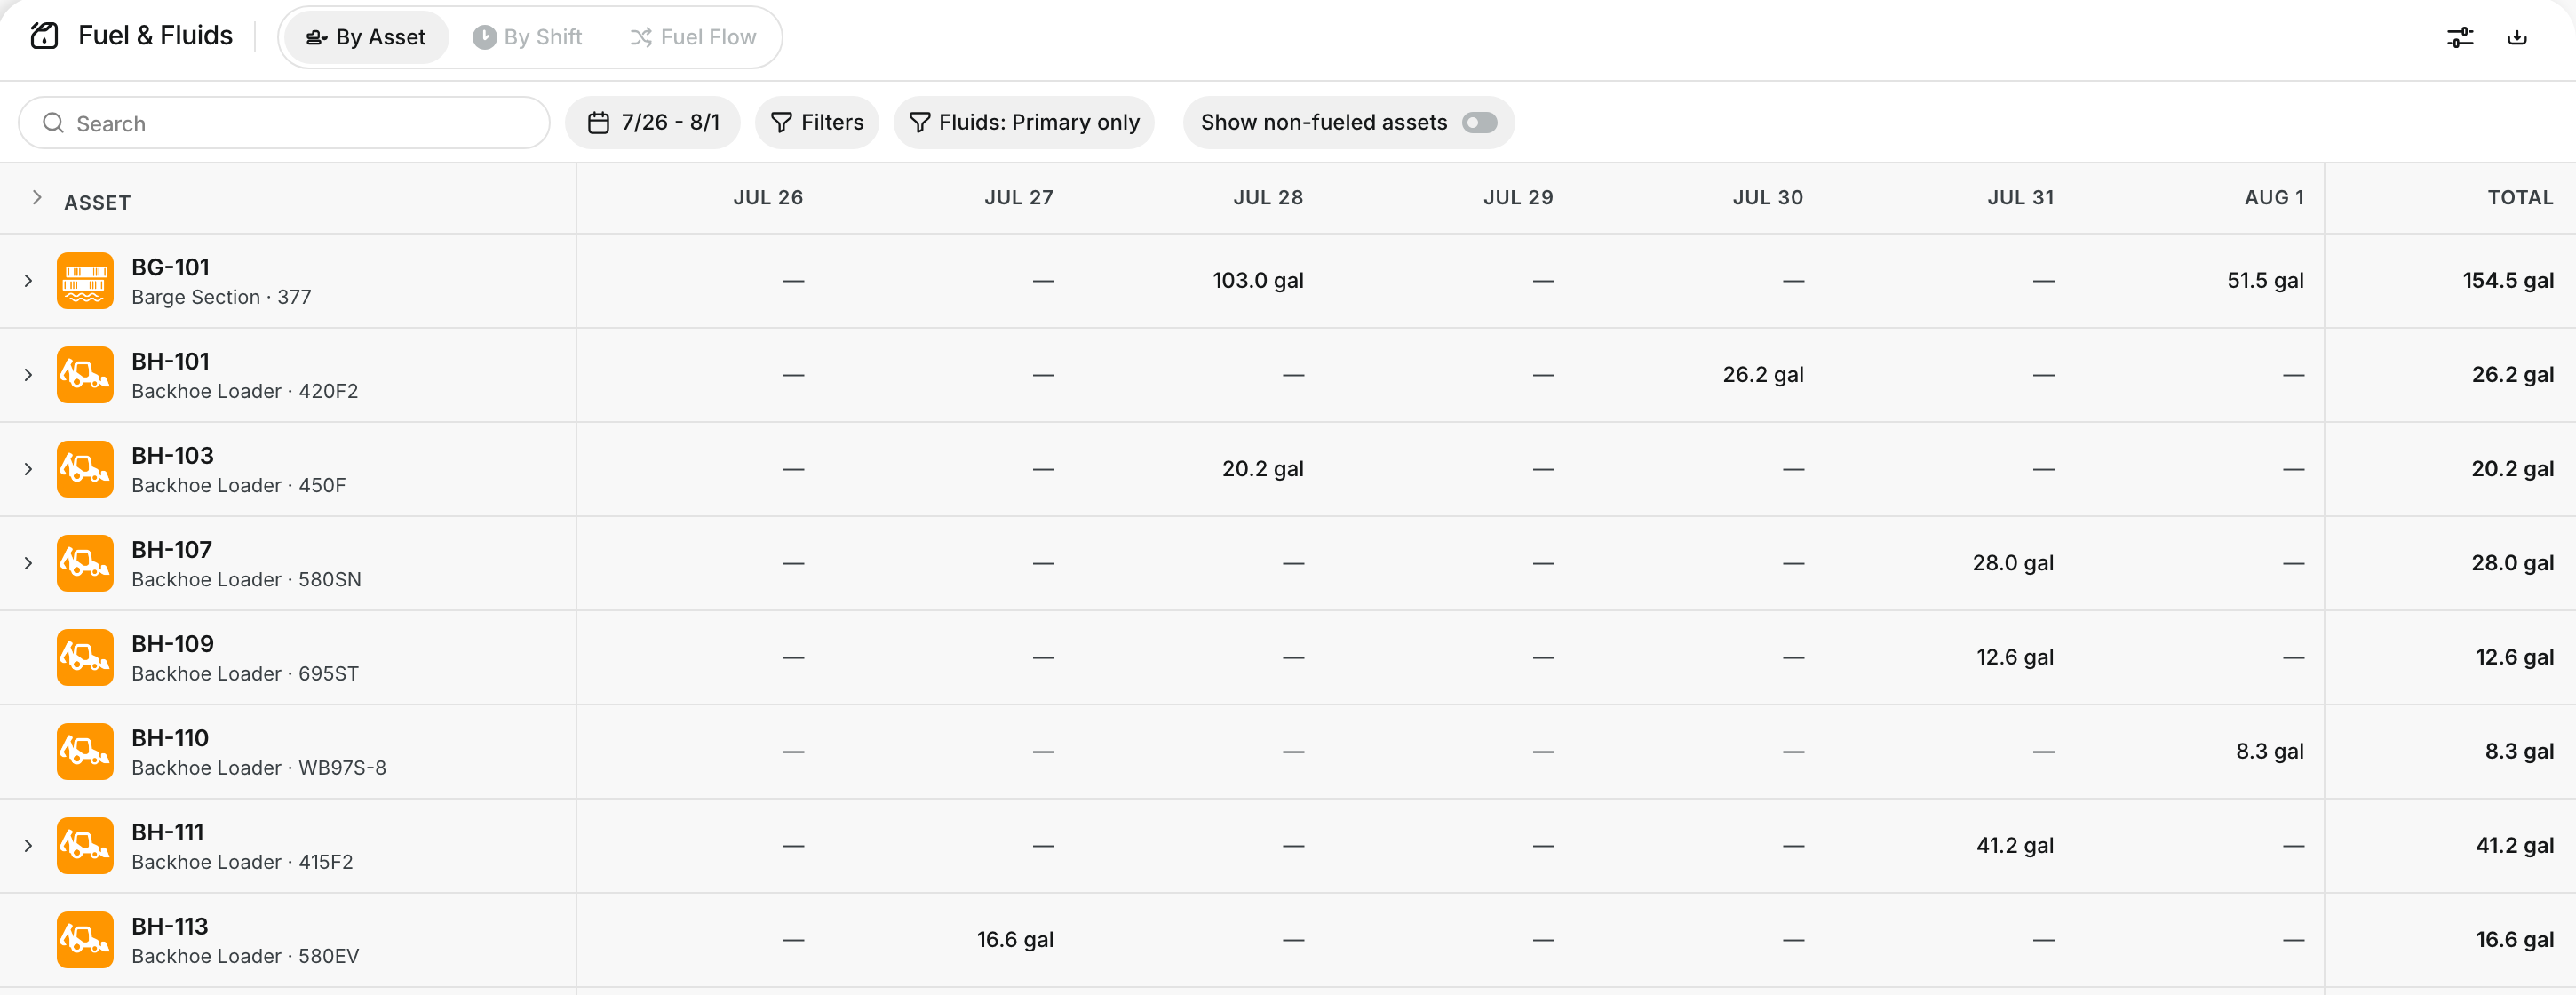
Each row is a machine and each column is a day. A cell shows the primary fuel filled that day, and the last column shows the total for the period. The Total row at the bottom adds up each day for the whole fleet.
Step 4: See who fueled a machine
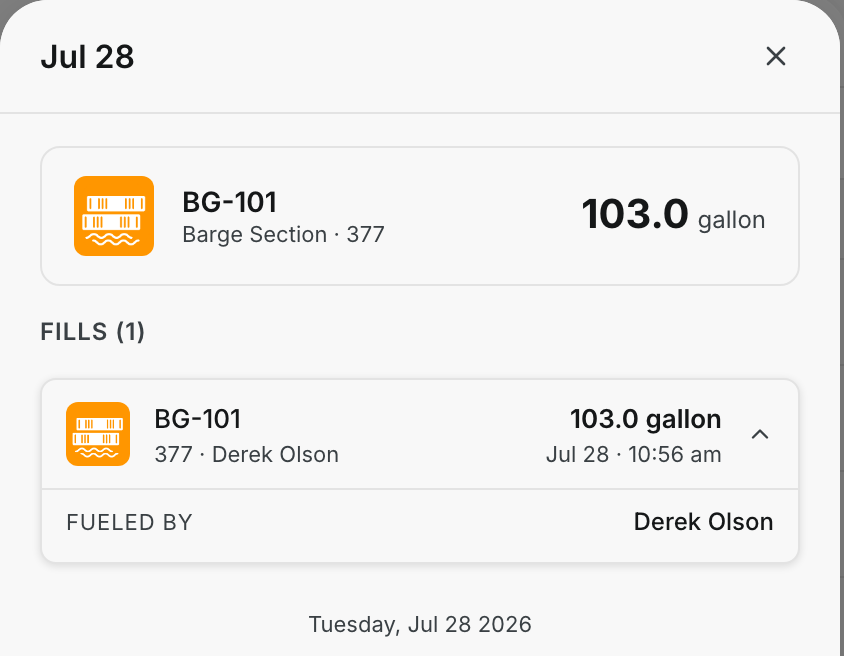
Click a number in the grid. A panel opens with each fill for that machine and day: the amount, the time and who fueled it.
Step 5: Add fluids
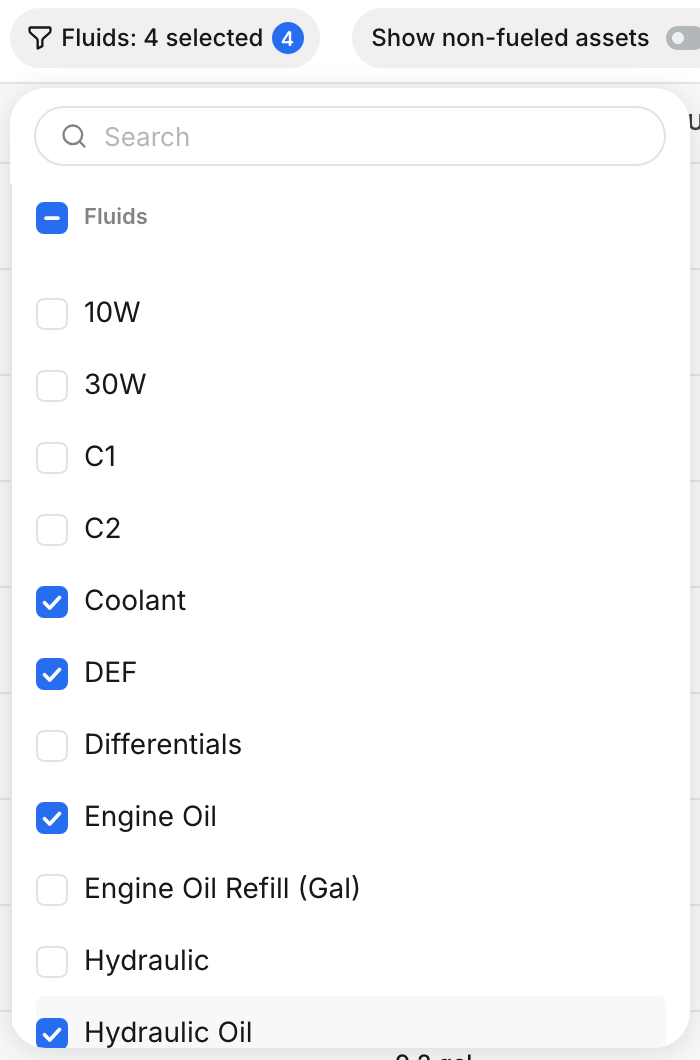
Click Fluids: Primary only and select the fluids you want, for example Coolant, DEF and Engine Oil. Then click the arrow next to a machine to see its fluid rows. The arrow next to Asset opens all machines at once.

Step 6: Filter the report
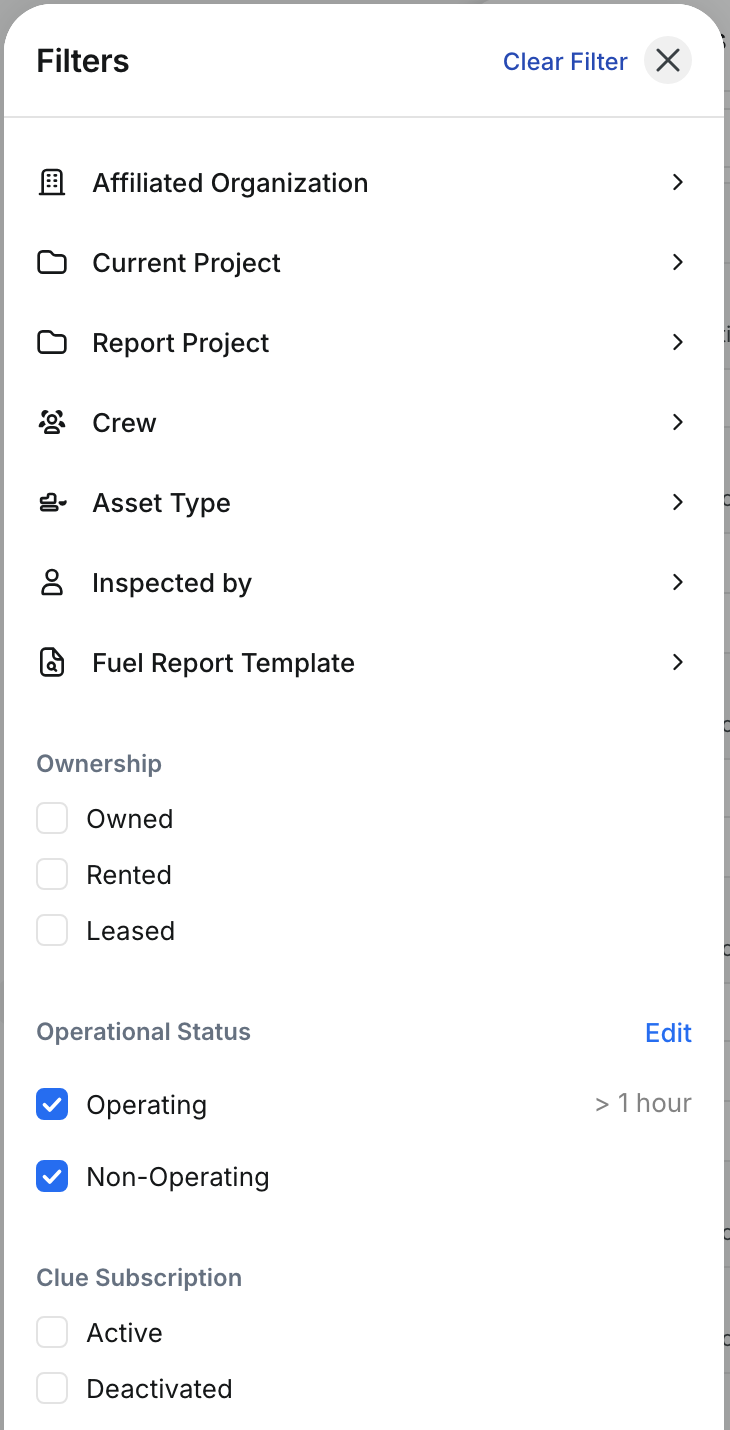
Click Filters to narrow the grid by project, crew, asset type, the person who logged the fill, the fuel report template, ownership and more. Turn on Show non-fueled assets to also list machines that took no fuel in the period.
Step 7: Check fuel truck shifts
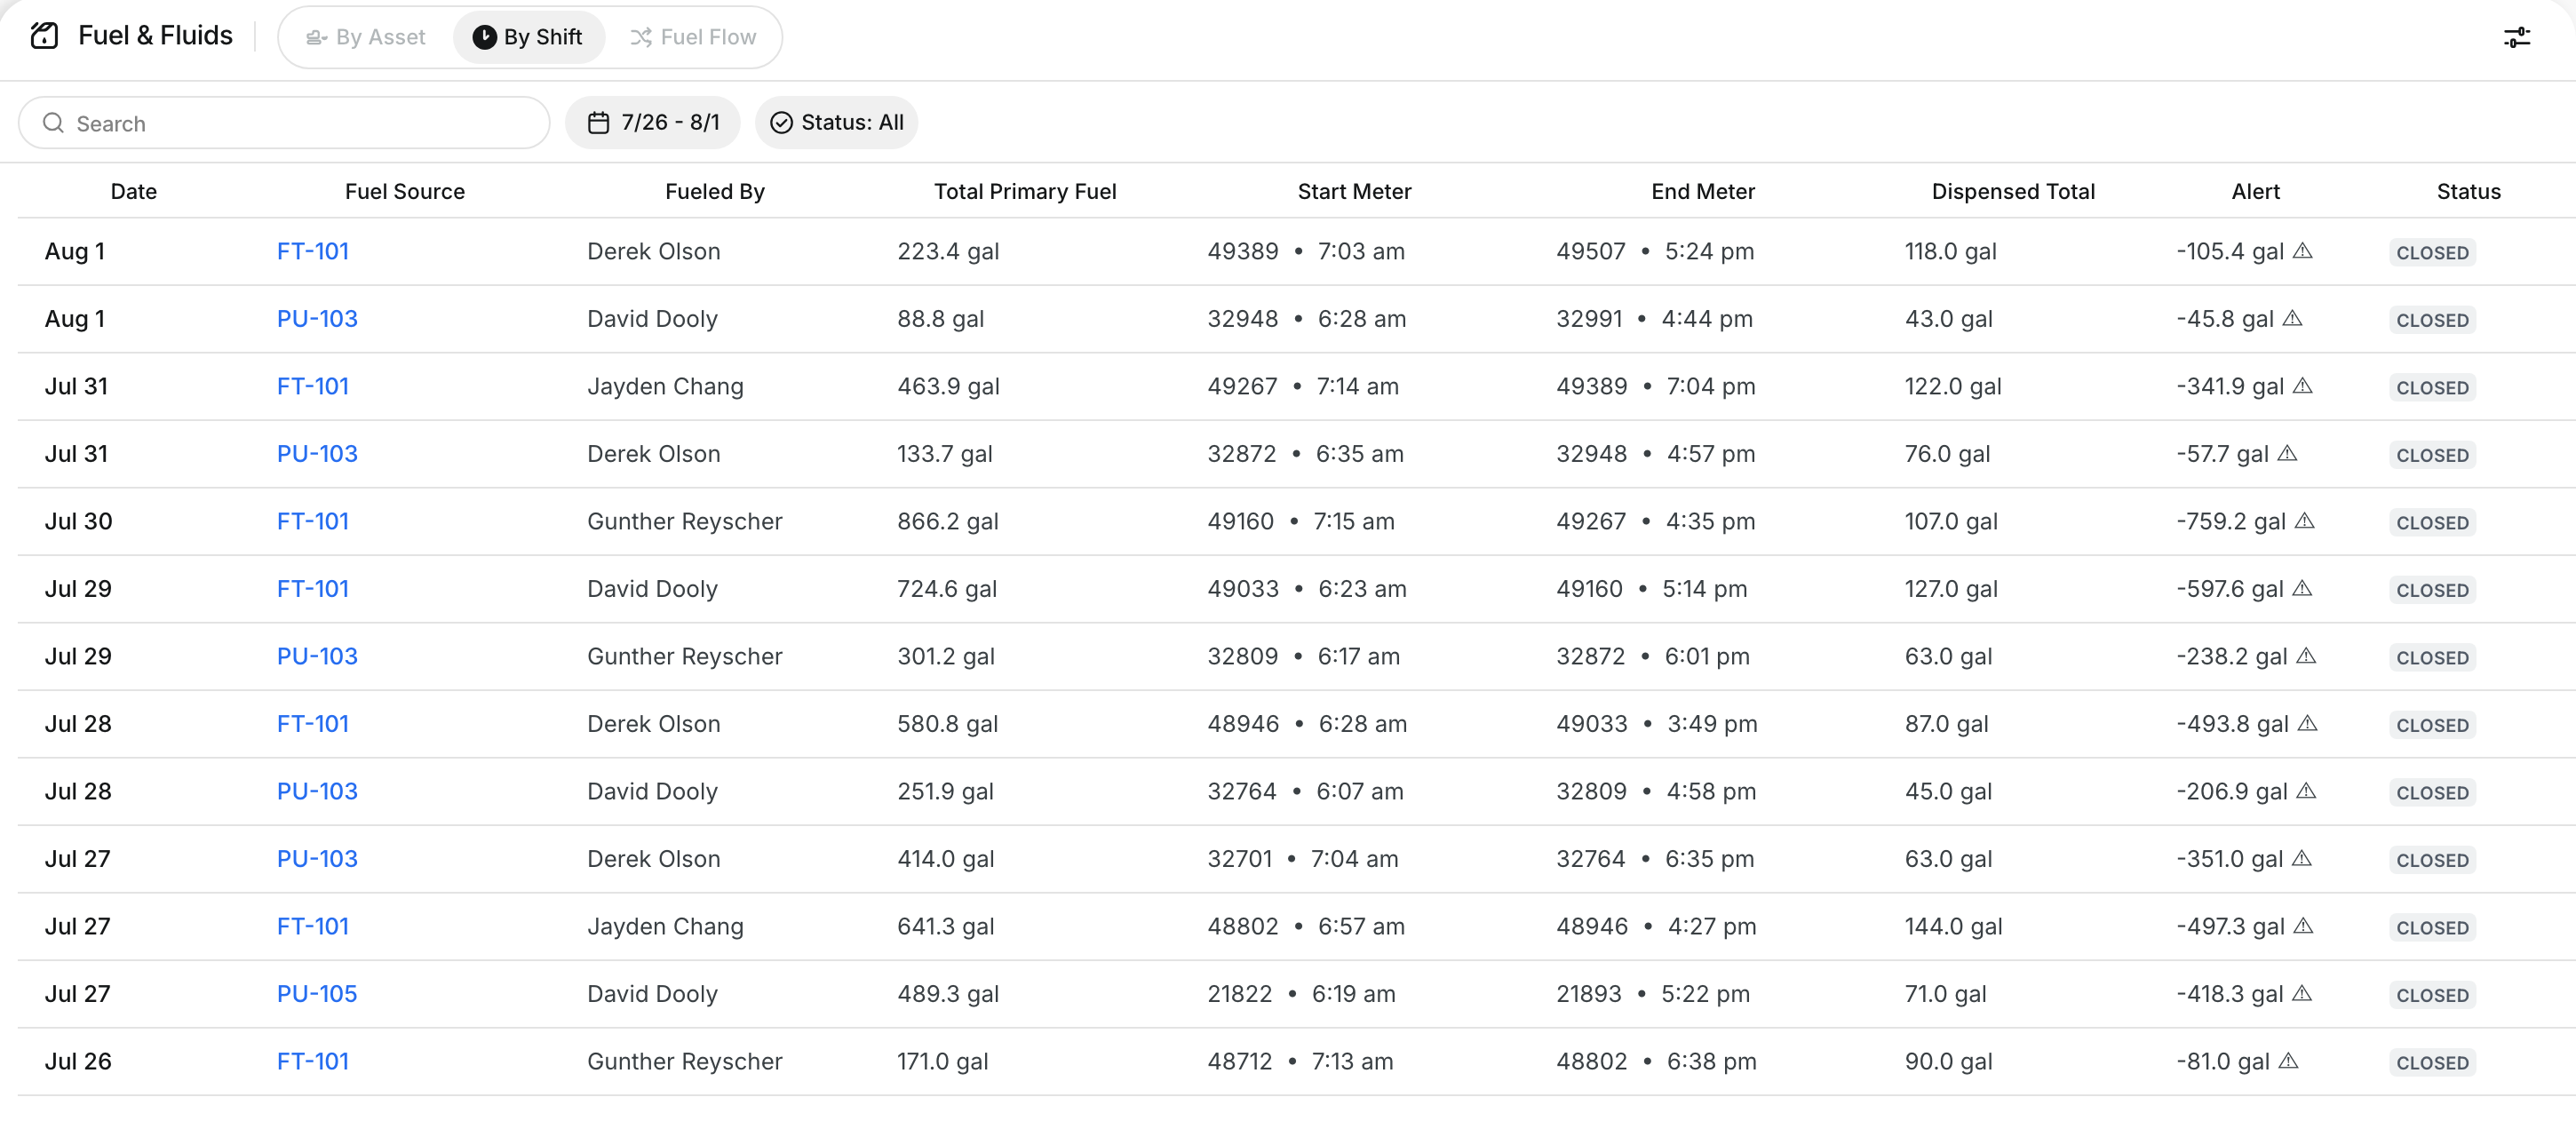
Open the By Shift tab. Each row is one fuel truck shift with its Start Meter, End Meter and the fuel that was logged. The Alert column shows the gap between the meter and the logged fills. Use Status to show open or closed shifts only.
Step 8: Open a shift
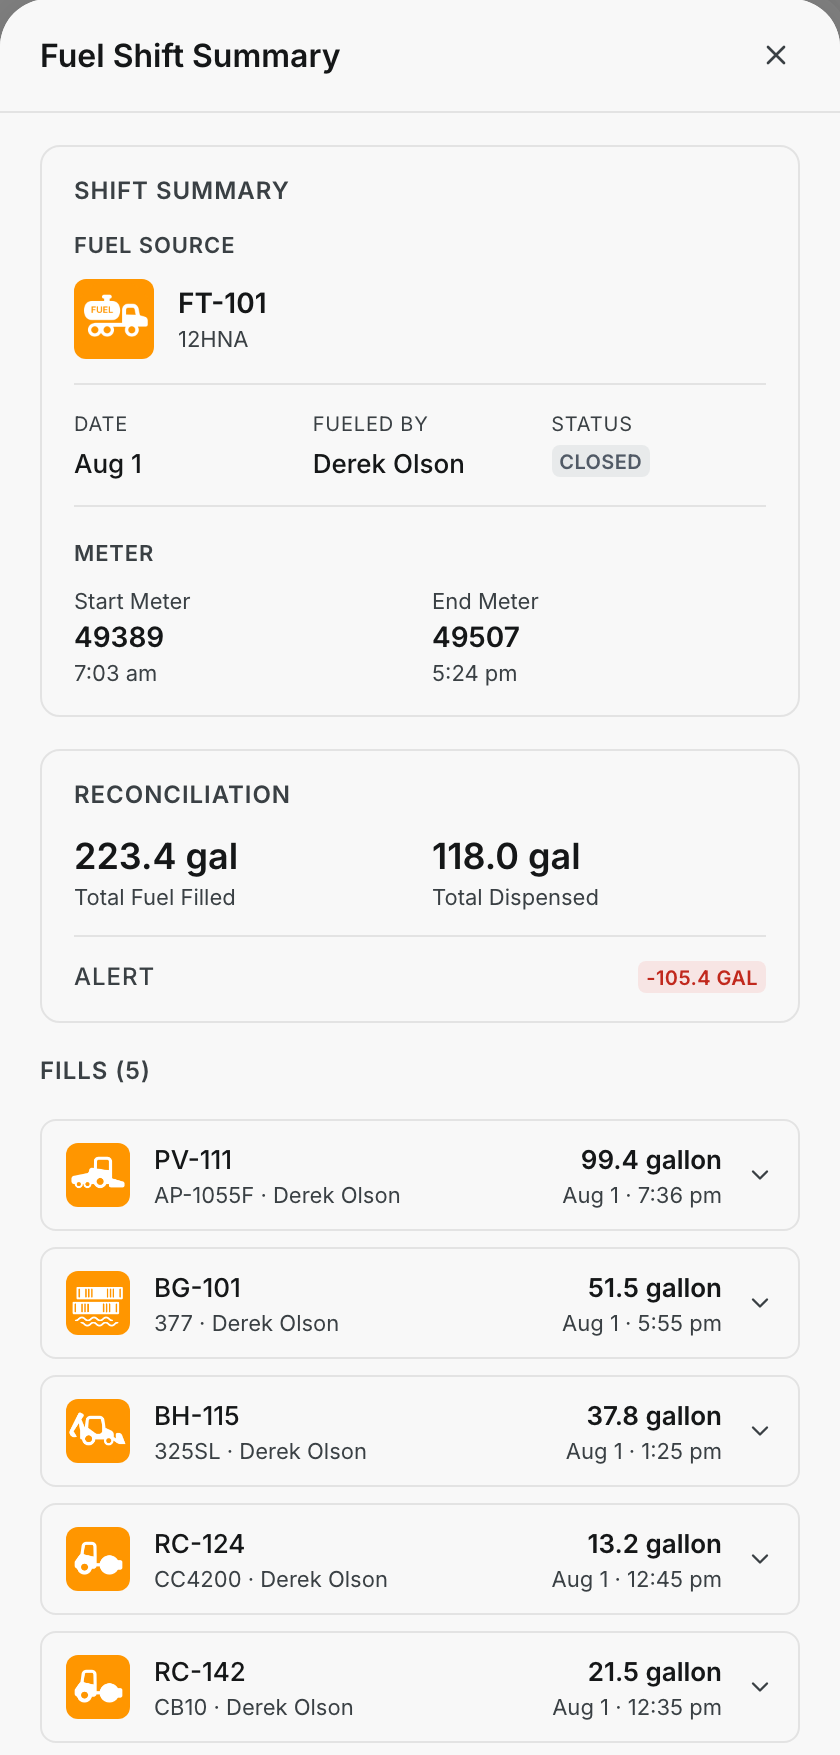
Click the truck name in the Fuel Source column. The Fuel Shift Summary shows the meter readings, the reconciliation and every fill made during the shift.
Step 9: Follow the fuel
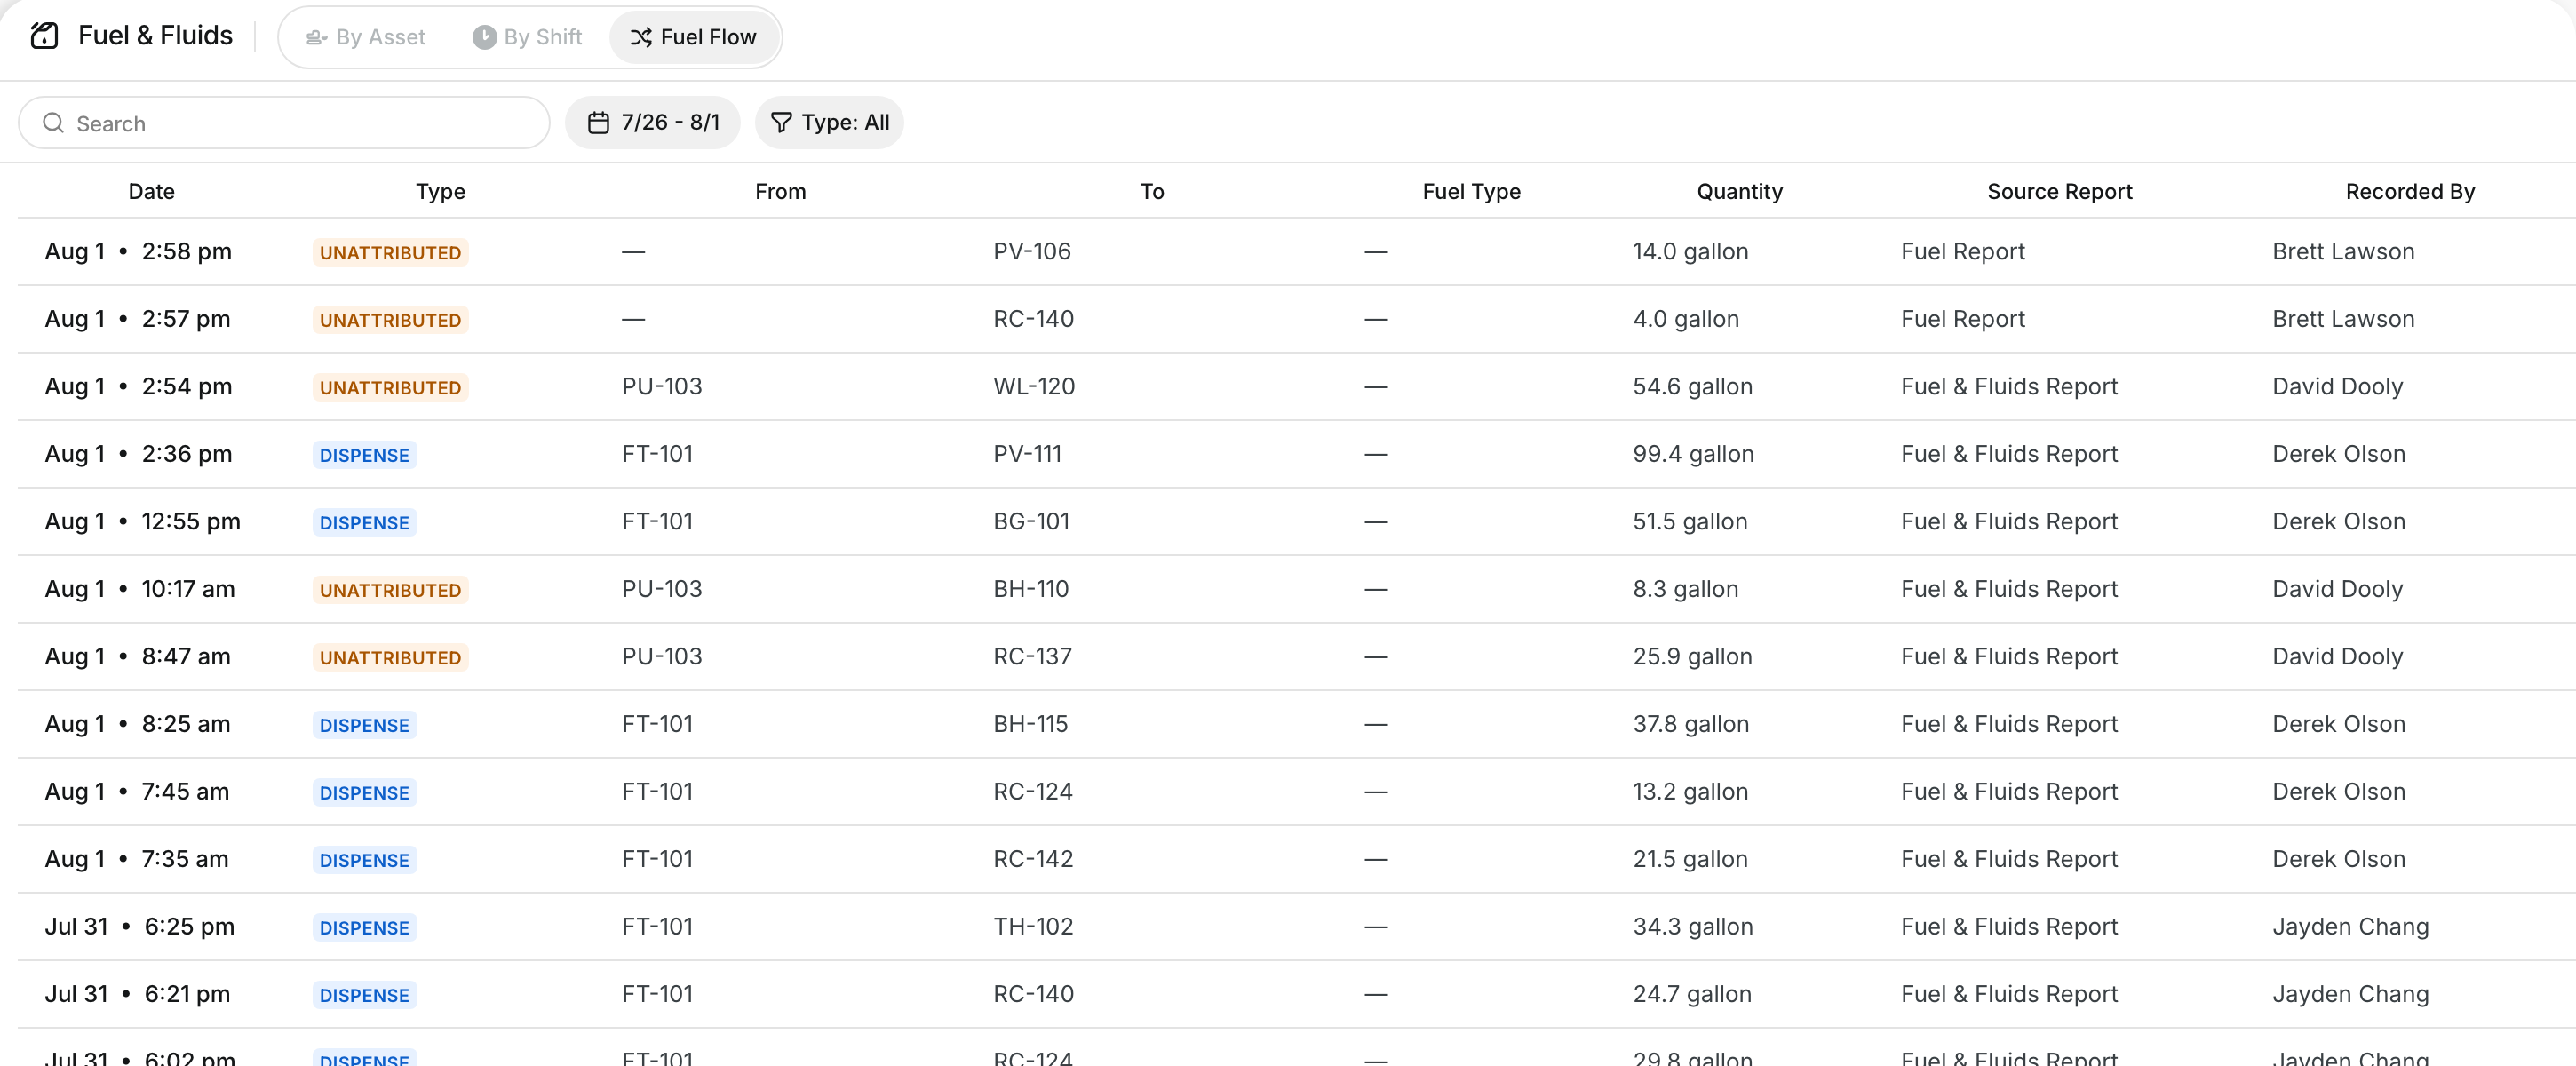
Open the Fuel Flow tab. Each row is one fill, with the truck it came From, the machine it went To, the quantity and who recorded it. Use Type to show one kind of transaction.
Step 10: Download the report
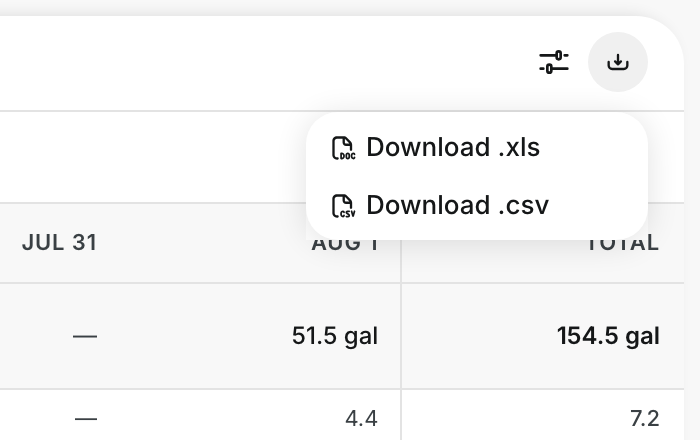
On the By Asset tab, click the download icon at the top right. Choose Download .xls or Download .csv. The file has the same rows and filters you see on screen.
The full details
- Where to find it: Insights > Reports > Fuel & Fluids, in the web app.
- Where the numbers come from: the fuel reports your crews submit from the field.
- Date range: up to 31 days at a time. Each fill counts on the local day it was logged.
- Project hint: when a machine took fuel on more than one project in a day, the cell shows how many projects.
- Display options: the settings icon at the top right turns the Total column on or off.
- Dispensed Total: the end meter minus the start meter of the fuel truck shift.
- Alert (By Shift): the dispensed total minus the fuel logged on fills. A check mark means they match. A warning sign means they do not.
- Dispense: fuel that went from a fuel container, like a fuel truck, into a machine.
- Purchase: fuel that went into a fuel container from a source that is not another container, for example a supplier.
- Delivery: fuel that went from one fuel container to another.
- Unattributed: fuel that went into a machine with no fuel container picked as its source.
- By Shift tab: shows only when your company uses fuel truck shifts.
Tips
- Check By Shift at the end of each day. When the alert is large, open the shift and compare its fills with the meter.
- A high number of Unattributed rows means crews do not pick the fuel truck when they log a fill.
- Filter by Report Project to send fuel by job to accounting.
- Use Show non-fueled assets to find machines that took no fuel in the period.