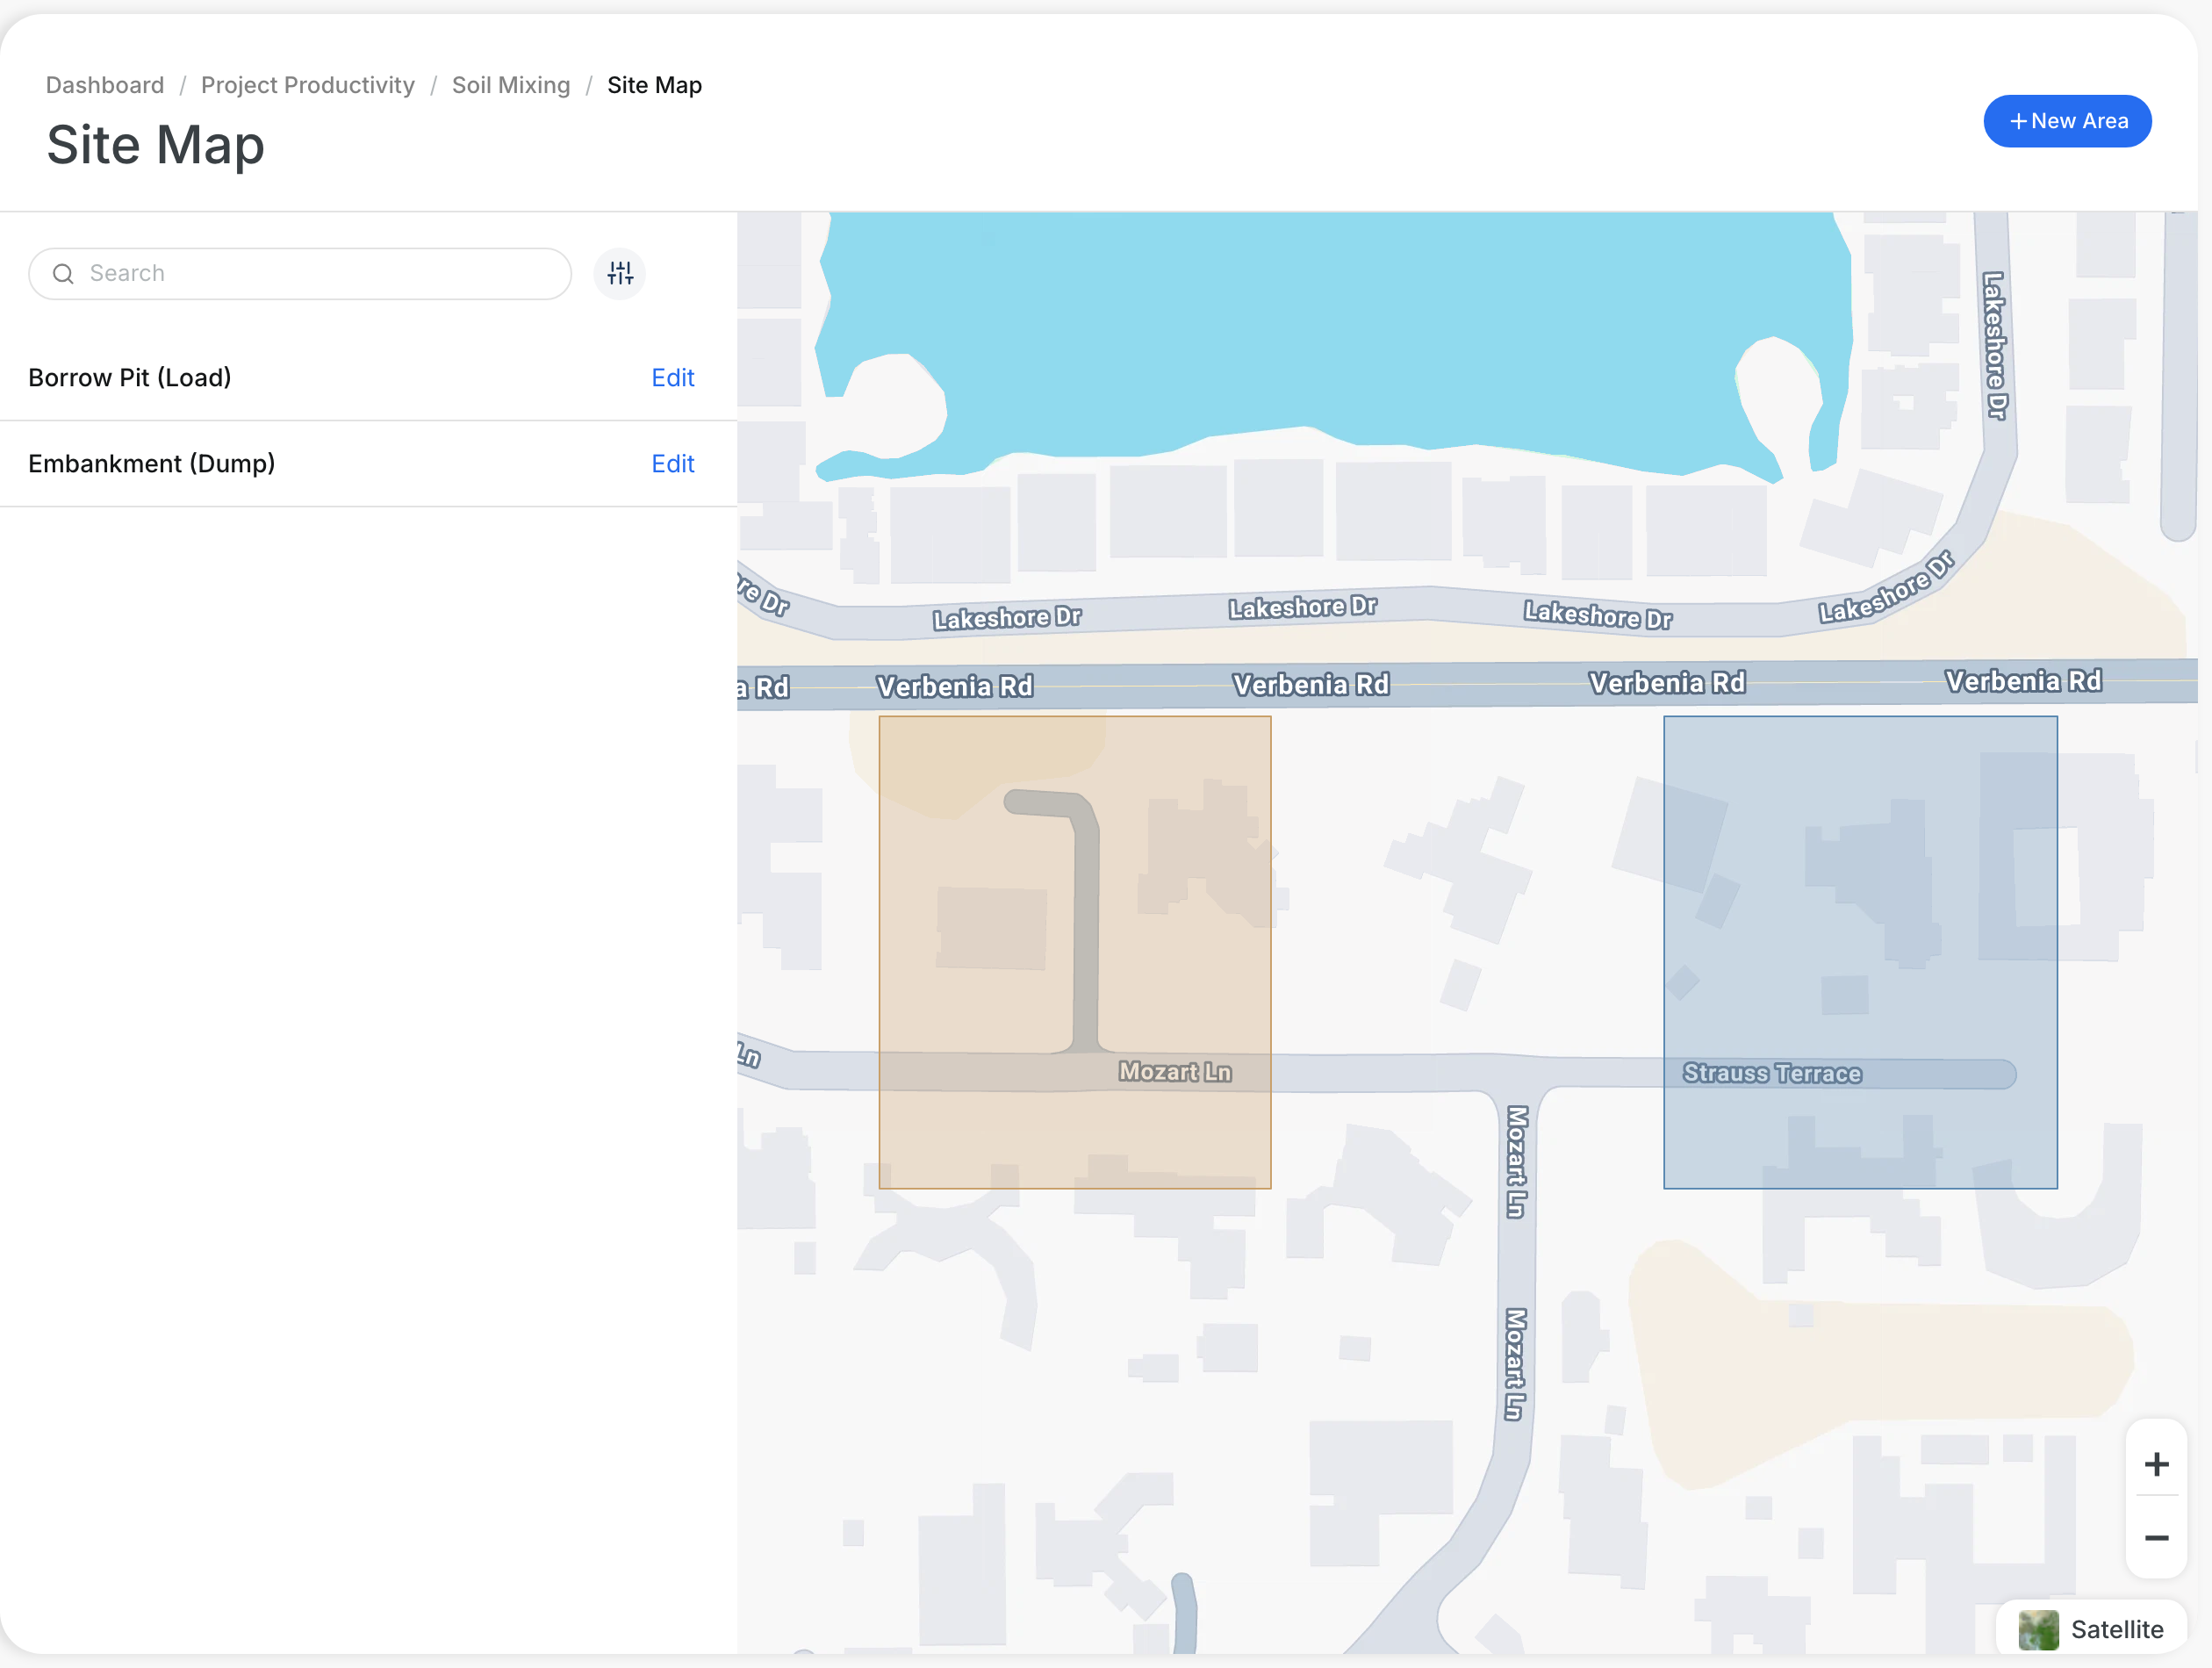
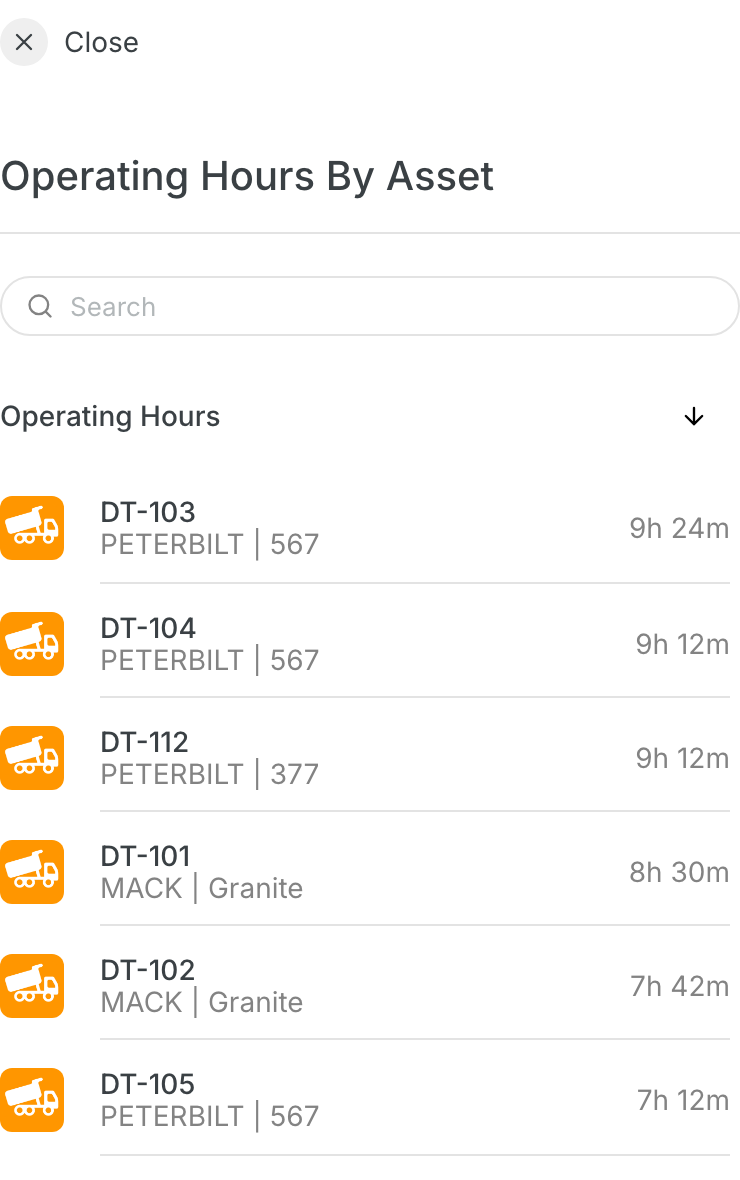
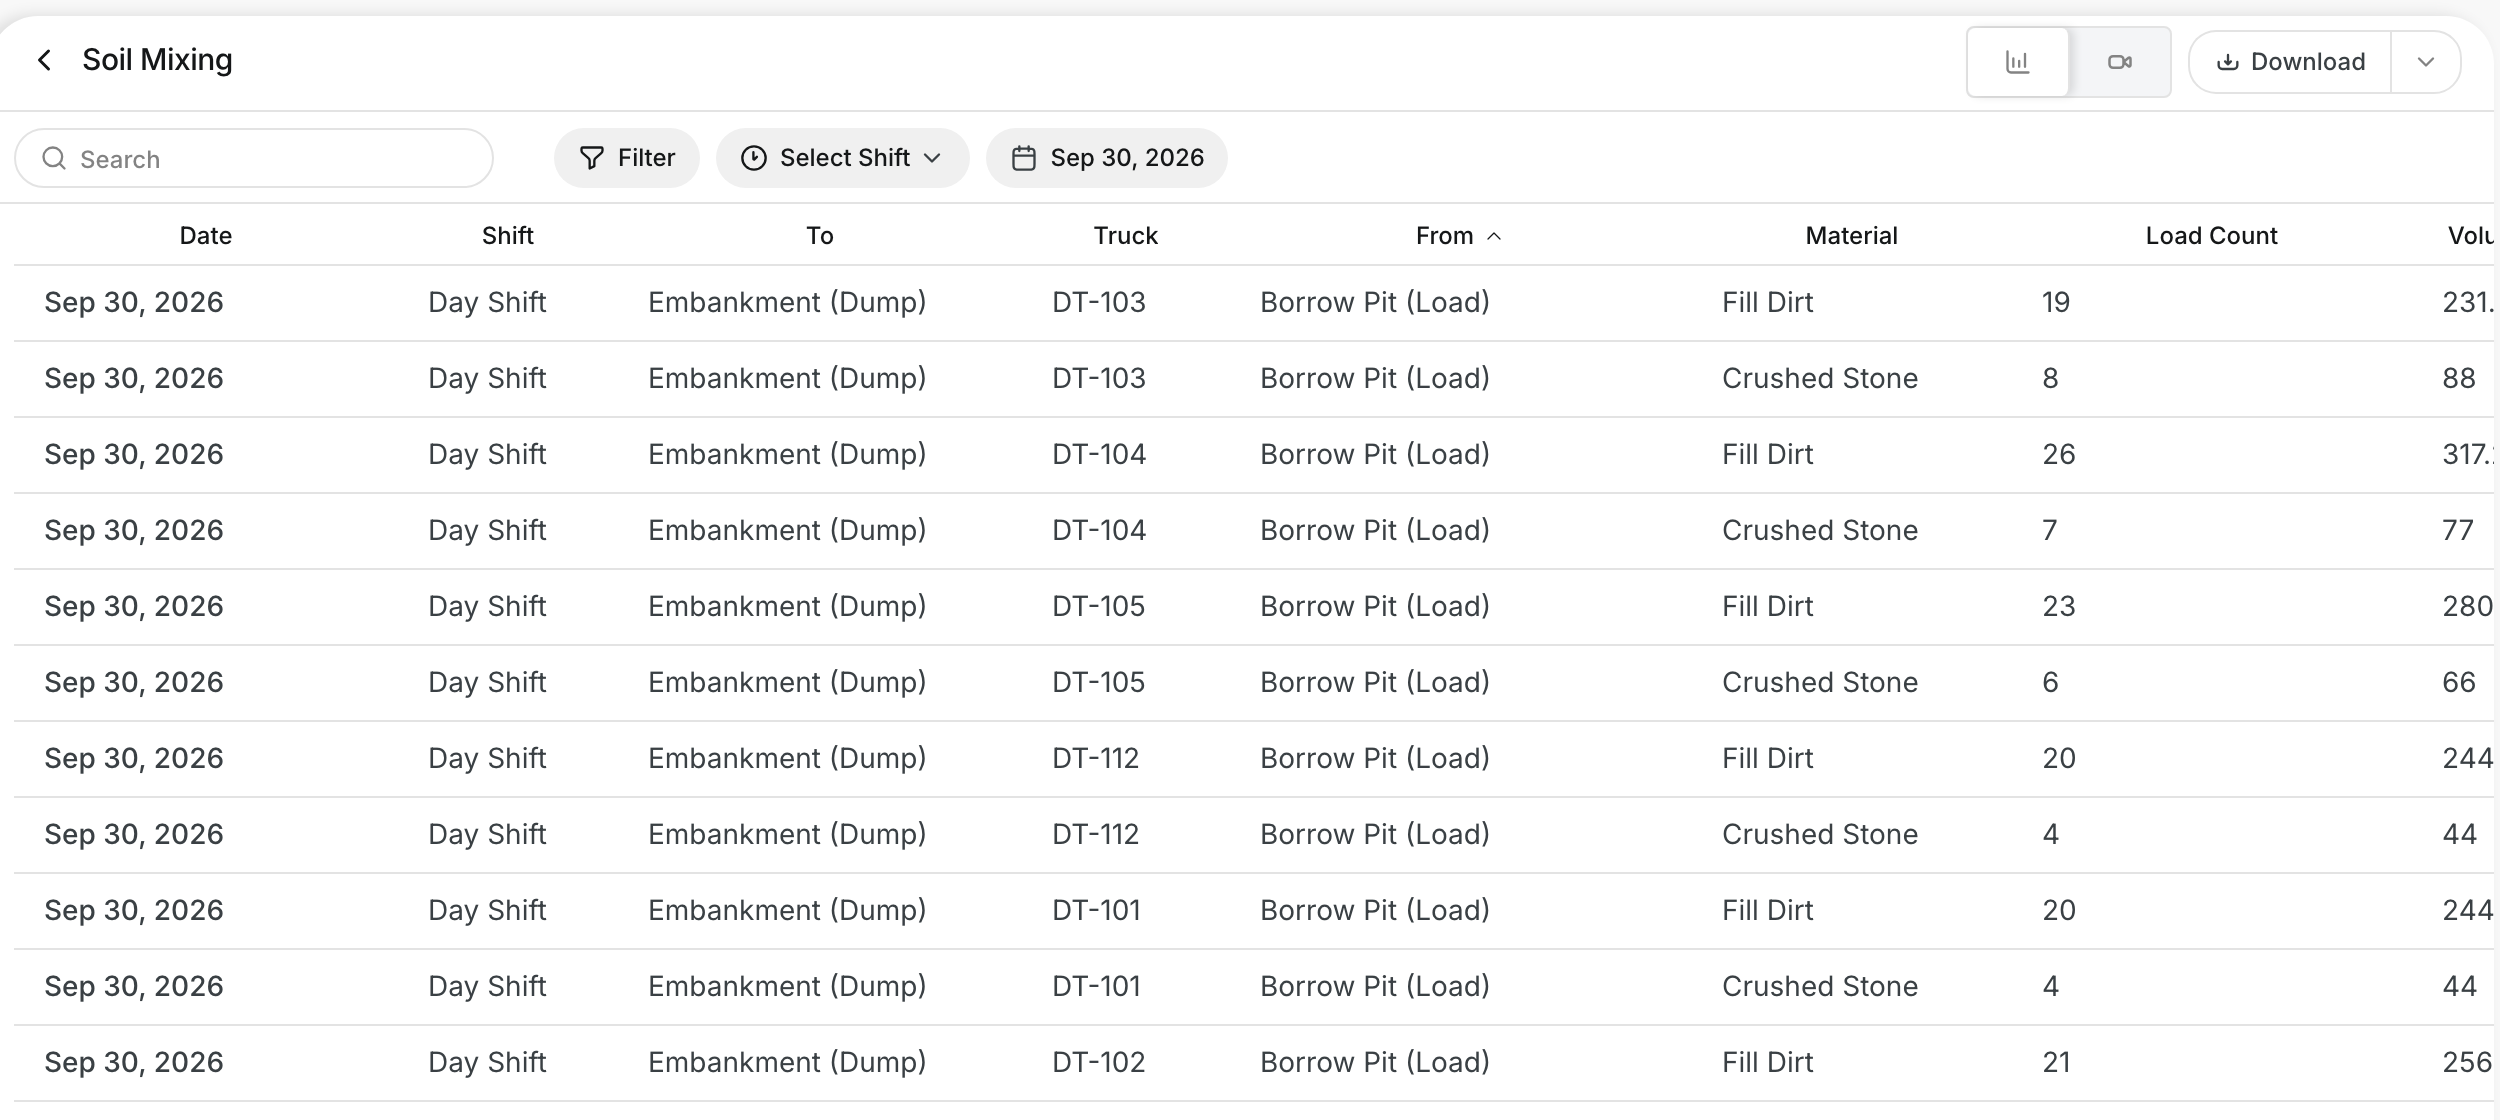
Cycle Time, Swing Time, and Cycle Time by Phase
Available now on Beta, This feature is in beta testing and will roll out to everyone soon.
What is this?
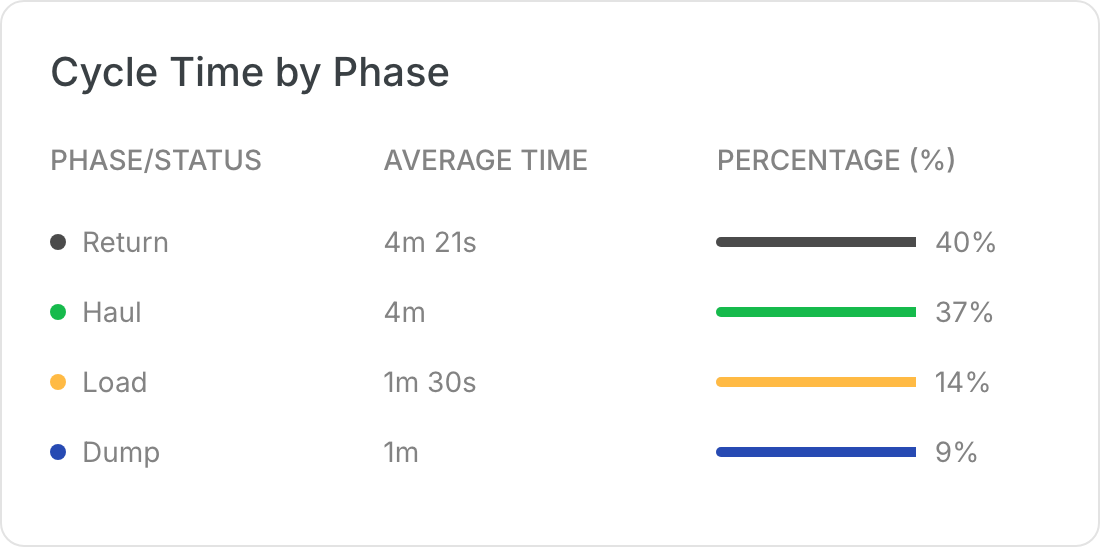
A cycle is one full truck trip. The truck loads, hauls, dumps, and returns. Average Cycle Time shows how long one trip takes. Average Swing Time shows how long the loading unit takes for one bucket swing. Cycle Time by Phase shows where the time goes in each trip.
Who's this for?
- Superintendents, to find the slow part of the haul.
- Foremen, to balance trucks and loaders during the shift.
- Estimators, to check real trip times against the bid.
How to use it
Step 1: Open the project and pick a day
Go to Operations > Production and click your project. Open the date box and pick the day you want.

Step 2: Read cycle time and swing time
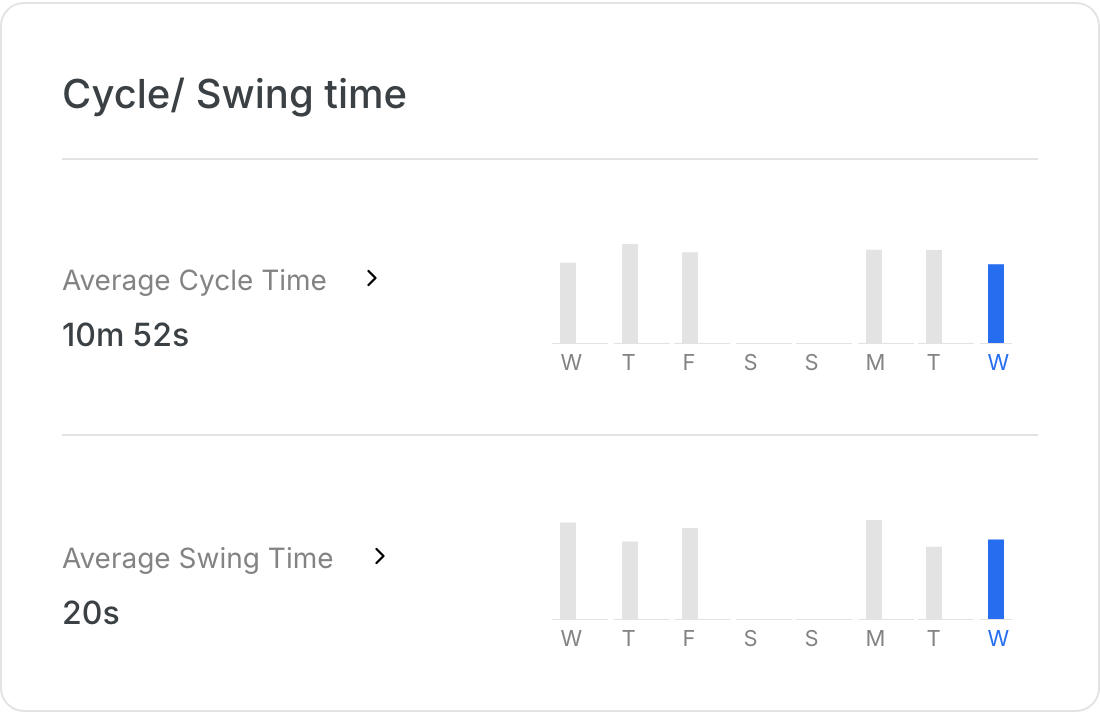
Find the Cycle/ Swing time tile. It shows Average Cycle Time and Average Swing Time. The bars show the last days, and the blue bar is the latest day.
Step 3: See time by phase
Find the Cycle Time by Phase tile. Each row shows a phase, its Average Time, and its Percentage (%) of the trip.
The full details
- Average Cycle Time: the average length of one truck trip.
- Average Swing Time: the average time for one loader bucket swing.
- Load: the truck is in the load Area and gets filled.
- Haul: the full truck drives to the dump Area.
- Dump: the truck empties its load in the dump Area.
- Return: the empty truck drives back to load again.
- Other statuses: rows such as waiting to load, breaks, or fueling can also show.
- Percentage (%): the share of the trip each phase takes.
Tips
- A long Return or Haul often points to a slow road or a long route.
- A long Load can mean trucks wait for the loader.
- Compare the blue bar with the gray bars to spot a slow day.