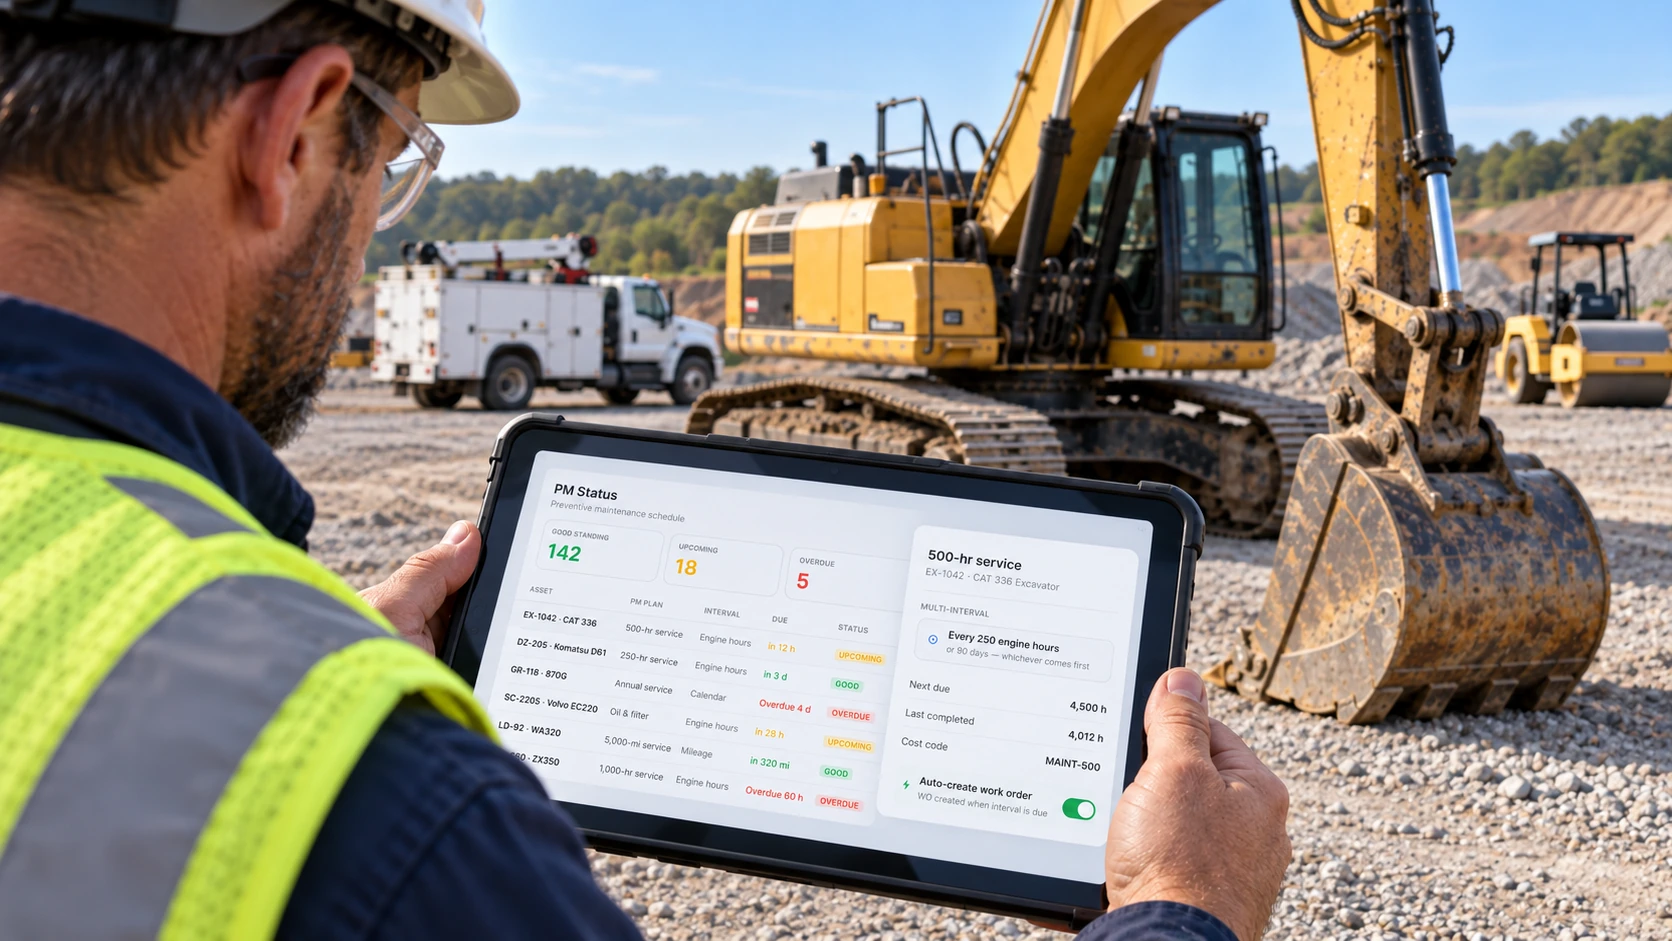
Fleet managers do not choose an excavator based only on the number of items on its spec sheet. They consider dealer support, parts lead times, and the cost of keeping the machine productive, because those factors help determine whether it is ready to work on Monday. Yet many buyers still evaluate fleet maintenance software as if it were only a feature checklist.
That is the wrong test. A platform can offer preventive maintenance, inspections, telematics, work orders, parts tracking, ERP synchronization, and analytics, yet still leave an excavator down for four days if those capabilities do not work together. The features exist; the workflow does not.
So the real question is not simply, “Does it have work orders?” It is: Does an inspection failure become a work order without someone retyping it? Does a fault code change what a technician does that morning? Does a parts shortage appear before the technician walks to the bay, or only afterward?
This guide covers the seven features that most directly influence whether heavy-equipment fleets reduce downtime, not just add more dashboards, plus three additional capabilities that can turn a maintenance system into a more effective maintenance operation.
What Is Fleet Maintenance Software?

Fleet maintenance software is a system that manages the maintenance lifecycle of vehicles and heavy equipment: scheduling service, capturing inspections, managing repairs, tracking parts, recording labor, and calculating what each asset actually costs to keep running.
It is a narrower job than fleet management software, which is built around location, routing, and movement. Equipment maintenance software is built around mechanical health: what is due, what is broken, what it took to fix, and what that history says about the asset going forward.
The strongest platforms do not stop at their own data. They pull in telematics for engine hours, utilization, and fault events, and connect to ERP systems for cost, labor, and purchasing records. The maintenance platform's job is turning that combined picture into a workflow a technician or a shop manager can act on.
The 7 Fleet Maintenance Software Features That Actually Move the Downtime Number
The right fleet maintenance software helps teams identify issues earlier, schedule work more efficiently, reduce repair delays, and understand the cost and reliability of each asset. Here are the seven capabilities that most directly influence whether those outcomes are possible.
1. Preventive Maintenance Automation
Most missed maintenance is not a scheduling failure. It is a trigger-mismatch failure.
A pickup runs on mileage. An excavator runs on engine hours. A crane inspection runs on a calendar date regardless of either. The gap is expensive. The U.S. Department of Energy's O&M Best Practices guidance estimates that a functioning preventive maintenance program saves 12 to 18% over a purely reactive one (U.S. DOE / PNNL). That saving only materializes if the system can trigger correctly for every asset type in a mixed fleet, not just the ones that fit a mileage-based template built for trucks.
Rented and leased machines complicate it further. A rental on a six-month job still accumulates hours against a service interval, but responsibility for that service may sit with the rental house, not your shop. A platform that cannot distinguish owned from rented assets will either nag your team about work that is not theirs or stay silent on work that is.
The differentiator is trigger flexibility. A basic platform runs one schedule logic and forces every asset to approximate it. A strong platform tracks engine-hour intervals, mileage intervals, and calendar dates independently, per asset, and surfaces upcoming and overdue service without anyone cross-checking three spreadsheets.
Important preventive maintenance capabilities include:
- Engine-hour-based maintenance scheduling
- Mileage-based service intervals
- Calendar-based maintenance
- Upcoming and overdue maintenance visibility
- Automatic work order generation
- Asset-specific maintenance plans
- Owned versus rented asset handling
Clue lets teams configure asset-specific preventive maintenance plans, combine related service schedules, and automatically generate work orders when maintenance is due. Confirm the exact engine-hour, mileage, and calendar-trigger behavior for the applicable Clue plan and integration before making a more specific promise.
2. Inspection-to-Work-Order Workflow

An inspection finding is only worth what happens to it next.
For the iron itself, the baseline is OSHA. 29 CFR 1926.601(b)(14) requires vehicles in use to be checked at the beginning of each shift to confirm that parts, equipment, and accessories are in safe operating condition and free of apparent damage that could cause failure in use. 1926.602 governs earthmoving and material handling equipment. That creates a recurring pre-shift inspection process for applicable vehicles and equipment. Companies should separately confirm what written records are required by their policies and by other applicable regulations.
For the truck side of a mixed construction fleet, meaning haul trucks, service trucks, and lowboys, the rules are stricter than most fleets realize. Under 49 CFR §396.11, the motor carrier or its agent must address a defect or deficiency likely to affect safe operation before requiring or permitting the vehicle to operate, and the report must be certified as repaired or as not requiring repair before the vehicle is operated again. The 2026 FMCSA final rule, Docket FMCSA-2025-0115, effective March 23, 2026, clarified that DVIRs may be created and maintained electronically. Electronic DVIRs were already permissible before this clarification under 49 CFR §390.32. Connecting an electronic inspection to a repair workflow remains a separate software capability.
The differentiator is whether the failed item survives the handoff. A basic platform records that an inspection happened. A strong platform turns a failed item directly into a work order task, with the photo, the note, and the original defect still attached, so nothing gets re-typed or lost between the field and the shop.
Important inspection capabilities include:
- Digital inspection forms
- Failed inspection item tracking
- Photo attachments
- Issue prioritization
- Automatic work order creation
- Inspection history linked to assets
Clue converts failed inspection items into work order tasks automatically, keeping the original defect, photo, and technician note connected all the way to the repair, so a safety-affecting item cannot quietly disappear between the jobsite and the shop.
3. Telematics Data Normalized Into Maintenance Triggers
Telematics tells a fleet manager what happened. It does not decide what to do about it. That is the maintenance platform's job, and it is harder than it looks, because machine data does not behave consistently across brands.
John Deere's ISO 15143-3 fleet endpoint caches its response for an hour and recommends polling no more often than that (John Deere Developer Portal). Other providers throttle on entirely different terms. Units are not standardized either. Geotab returns odometer values in meters and engine hours in seconds, not the decimal hours a fleet manager expects on a report (Geotab, 2026). A platform that does not normalize these differences will show engine hours climbing impossibly fast on one source and looking artificially reliable on another. Neither is true. It is a unit mismatch, not a mechanical difference.
Fault codes have the same problem in a different form. A single machine can throw dozens of codes in a week, most of them informational. Derate warnings, aftertreatment faults, and hydraulic-pressure events may require prompt attention because ignoring them can lead to expensive recovery or repair work. Without severity mapping and OEM-specific code libraries, a fault feed is noise, and shops learn to ignore it. Clue publishes a free construction equipment fault code guide for exactly this reason.
The differentiator is whether telematics data gets normalized into something a maintenance schedule can use, across every brand in a mixed fleet, not just the primary one.
Modern equipment can provide data such as:
- Engine hours
- Mileage
- Equipment location
- Utilization
- Diagnostic events
- Fault information
Telematics data alone does not reduce downtime. The value comes when that information is connected to maintenance decisions. Fleet maintenance software should use telematics information to support:
- Preventive maintenance scheduling
- Fault-code review and severity triage
- Equipment prioritization
- Service planning
- Reliability analysis
Clue connects with 80+ GPS, OEM telematics, ERP, maintenance, and equipment technology integrations, including Caterpillar VisionLink, John Deere JDLink, Komatsu Komtrax, Volvo CareTrack, Geotab, and Samsara. It brings equipment data from these connected systems into one operational view, normalizing key information such as engine hours, fault events, location, and utilization. This allows maintenance teams to trigger preventive maintenance workflows based on real equipment usage, regardless of which telematics source the machine reports through.

4. Work Order Management That Connects the Shop and Field
A work order that only the office can see is a record. A work order the technician can update from the cab, the bay, or the trench is a workflow.
The U.S. Bureau of Labor Statistics projects about 21,700 annual openings for heavy vehicle and mobile equipment service technicians through 2034, against a workforce of roughly 245,600 (BLS, 2024 to 2034 projections). Separately, TechForce Foundation reported 11,310 postsecondary diesel completions in 2023, while the approximately 26,500 annual-opening figure belongs to the separate BLS occupation for diesel service technicians and mechanics. These figures illustrate labor-supply pressure, but they are not a direct one-to-one shortage ratio because the occupation definitions and measurement periods differ. These labor-market pressures make technician time especially valuable in many shops. A work-order system that forces technicians back to a desk to log labor, request parts, or close a task can consume time the fleet needs for repairs.
Connectivity is a practical constraint that software buyers should test. Jobsites may be located in river valleys, basements, tunnels, or remote rights-of-way where cellular coverage is unreliable. If the mobile app cannot capture labor, photos, and parts requests offline and synchronize after connectivity returns, technicians may revert to paper notes and the digital workflow can break at the moment it matters most.
The differentiator is mobile completeness, not mobile existence. A basic platform has a mobile app that displays the work order. A strong platform lets a technician assign, update status, log labor, request parts, and attach photos from the same device, in the field, without switching to a desktop to finish anything.
Important work order capabilities include:
- Technician assignment
- Repair scheduling
- Labor tracking
- Parts tracking
- Cost codes
- Repair status updates
- Maintenance history
- Offline capture with sync
Clue's work order system runs fully on iOS and Android, so a technician working a jobsite repair can log labor, request parts, and close the task from the same screen where the job started, and a shop manager sees the status update in real time instead of at the end of shift.
5. Parts Management Connected to Repairs

A diagnosed repair with no part on hand is not a repair in progress. It is a machine sitting idle with a known cause.
Parts availability is a downtime driver that additional staffing alone cannot solve. A skilled technician with an empty shelf cannot complete the repair faster than an empty bay can. Overstocking is not the answer either. Inventory carrying costs, including capital, storage, insurance, handling, and obsolescence, often represent roughly 20% to 30% of inventory value annually, depending on the business and the cost categories included. This range describes the cost of holding inventory generally; the carrying cost of dead or obsolete stock may be different.
The fix is not stocking more. It is knowing what is on hand at the moment a technician needs it.
The differentiator is whether parts data lives inside the work order or in a separate system a technician has to check manually. A basic platform tracks inventory. A strong platform lets a technician request a part directly from the repair, see what is available across locations, and capture the part cost against that specific job automatically.
Important parts capabilities include:
- Parts requests raised from inside the work order
- Multi-location stock visibility
- Reorder points on critical spares
- Part cost captured against the specific repair
- Usage history by asset and by failure type
Clue's inventory management lets technicians request parts straight from the work order and attaches the actual part cost to that repair, so a shop manager can see not just that a repair took three days, but that two of them were a part sitting at the wrong yard.
6. ERP and Job-Costing Integration
Maintenance does not just fix machines. It generates numbers the finance team relies on, and one accounting decision quietly distorts all of them: whether a repair is booked as an operating expense or capitalized as an investment in the asset.
Routine service is generally expensed. A major engine or undercarriage rebuild that extends useful life or improves the asset may qualify for capitalization under the company’s accounting policy and applicable standards. Misclassification can distort the asset’s internal cost profile and affect repair-versus-replace decisions, so the maintenance system should preserve the work-order facts that the finance team needs for the correct classification.
The scale of the problem can be material. For many contractors, repair and rebuild work represents a significant equipment cost, and the related labor, parts, and asset costs should be mapped to the appropriate job, asset, and cost-per-hour records downstream.
The differentiator is whether that classification happens automatically from the work order, using facts the maintenance system already holds, or whether it depends on someone in accounting guessing correctly from a repair description.
Important integration capabilities include:
- Bi-directional sync of equipment lists and job assignments
- Labor, parts, and repair costs posted to the correct cost codes
- Meter readings pushed from telematics into the accounting system
- Expense versus capital classification driven by the work order type
- No duplicate data entry between shop and back office
Clue integrates with the ERP and CMMS systems contractors already run, including Trimble Viewpoint Vista, HCSS HeavyJob and Equipment360, CMiC, Sage, and Oracle JD Edwards E1, so labor, parts, and repair costs post to the correct cost codes automatically.
7. Maintenance Analytics and Asset Reliability Insights
A repair log tells you what already occurred. Analytics are supposed to tell you what to do next, and most maintenance software stops one step short of that.
Two numbers rarely make it into a basic report. Mean time between failures (MTBF) is total operating time divided by the number of defined failures during the measurement period. Availability is scheduled time minus downtime, divided by scheduled time. Tracked per asset over time, these two answer the question every fleet manager actually cares about: is this specific excavator becoming less reliable, or was last month just unlucky?
The differentiator is whether analytics operate at the asset level or only the fleet level. A basic platform reports total maintenance spend. A strong platform tracks MTBF, availability, and downtime cause on individual assets, so a manager can catch the one machine that is quietly deteriorating before the fleet average hides it.
Important analytics capabilities include:
- MTBF and availability tracked per asset, not fleet-wide
- Downtime broken out by cause: diagnosis, labor, parts, or scheduling
- Repeat-failure detection on the same component
- Trend comparison across identical asset classes
- Exportable reporting for finance and operations reviews
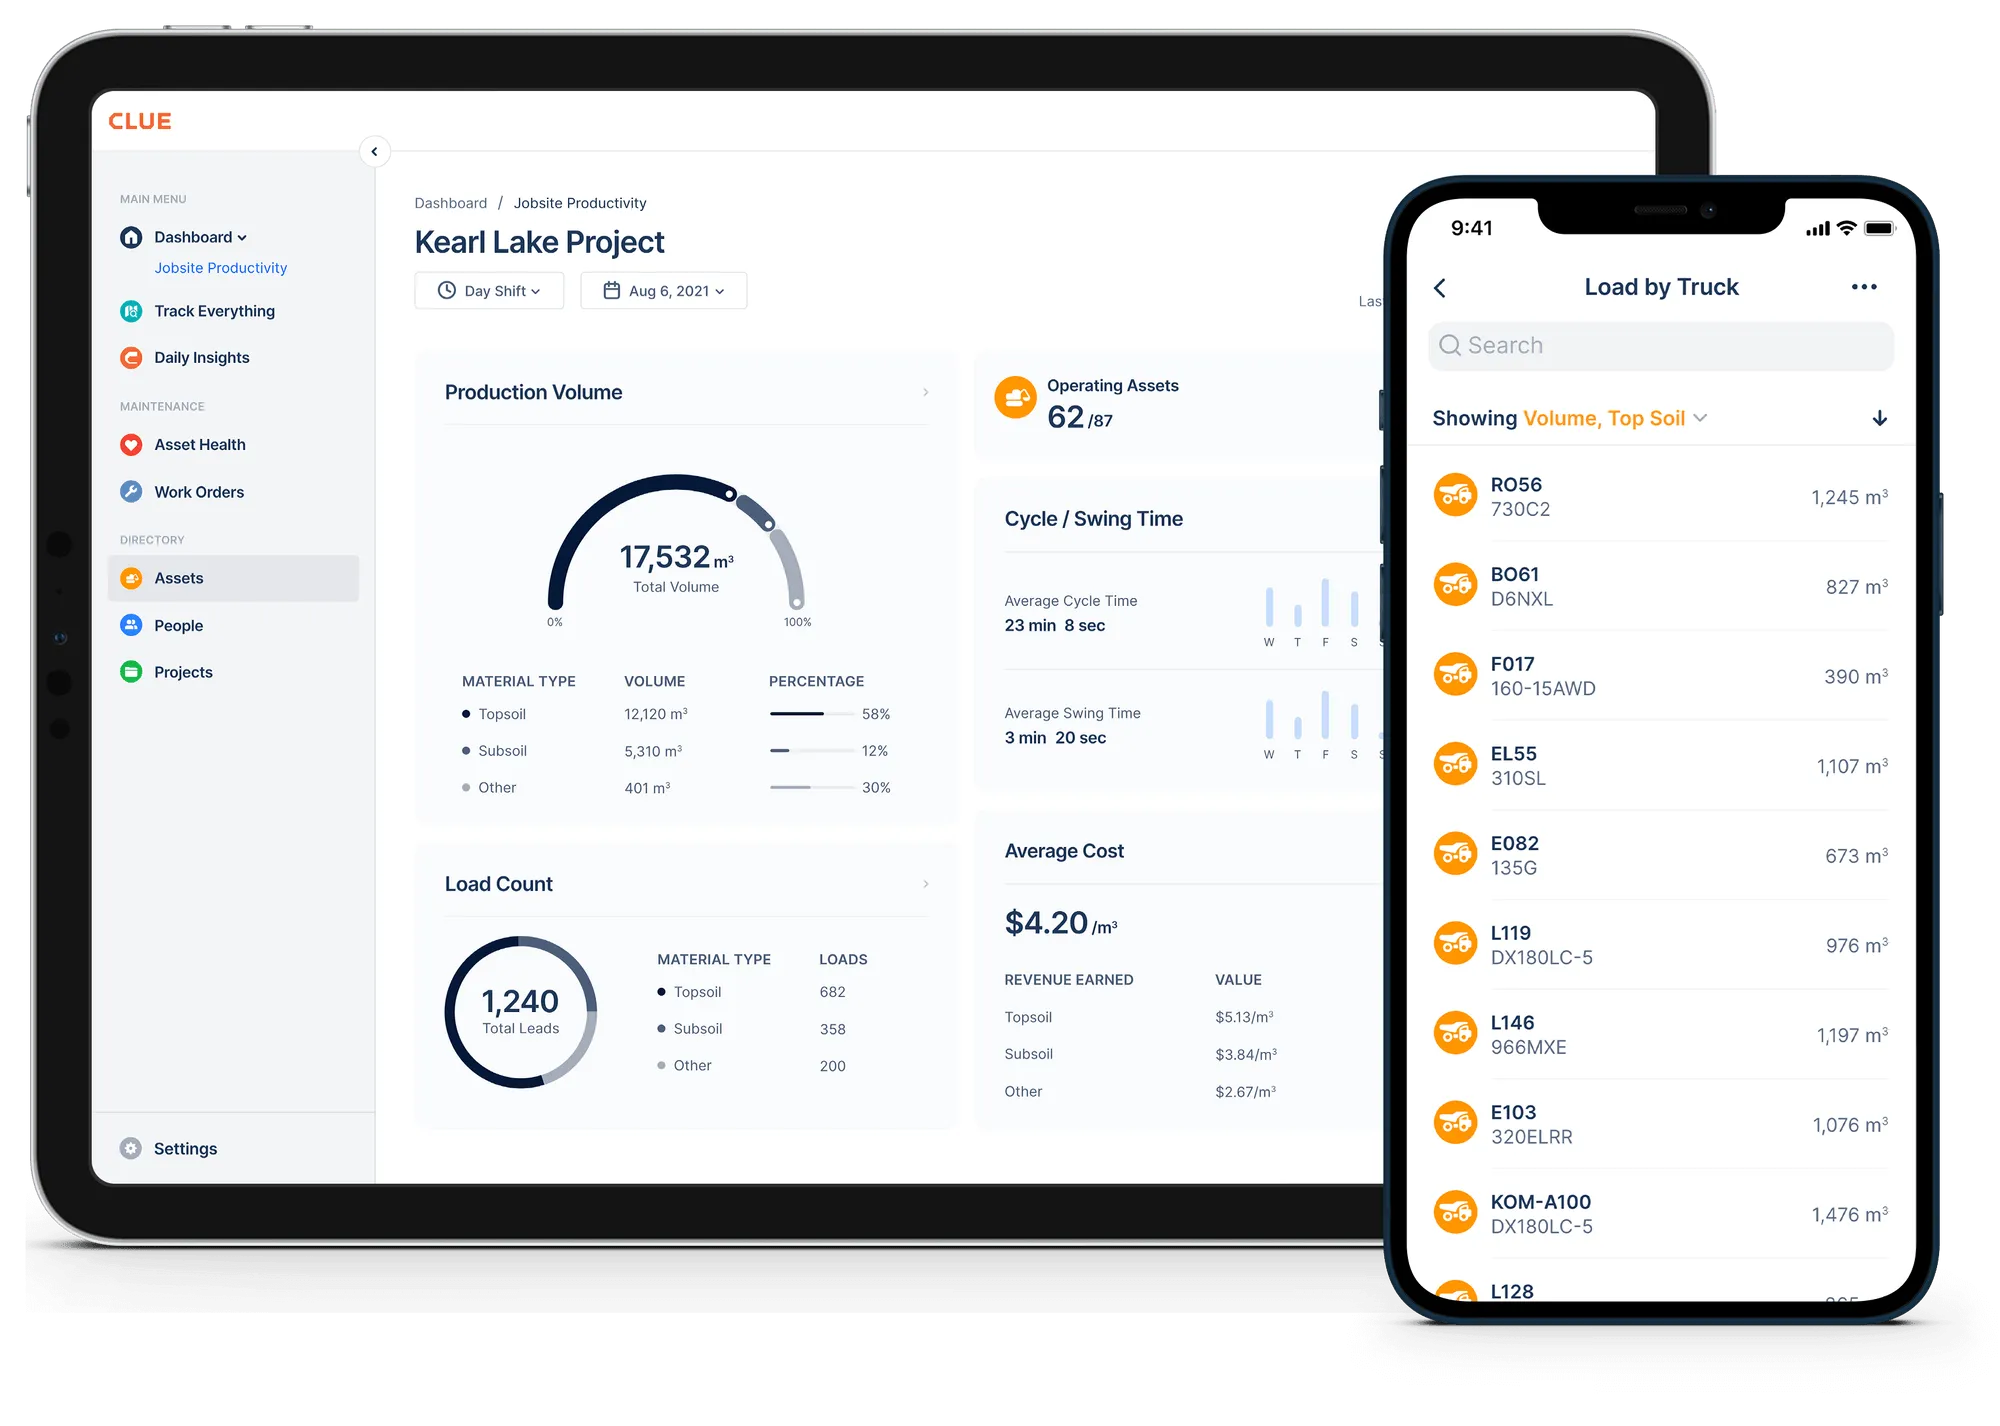
Clue's reporting and analytics track maintenance cost, downtime, and reliability trends down to the individual asset, so a deteriorating machine surfaces as a trend line instead of a surprise.
Three Capabilities Most Buyer Guides Skip

Many “top features” lists stop at seven. Three more decide whether a platform actually changes fleet economics.
Asset-Level Cost-Per-Hour
Total maintenance spend is nearly useless on its own. Cost per operating hour, tracked per asset and split between ownership and operating costs, is what tells a fleet manager whether a specific machine is still worth running.
Without it, two machines with identical total spend can have completely different stories. One is earning its keep across 2,000 hours a year. The other is burning the same dollars across 400. Clue's equipment economics module pulls fuel, repairs, rentals, and insurance into one view so ownership and operating costs stay separated. Our guide on construction equipment costs breaks the full calculation down.
Repair-vs-Replace Scoring
The hardest maintenance decision is not scheduling the next service. It is knowing when to stop scheduling it.
A platform that surfaces rising repeat-failure rates and climbing cost-per-hour on a specific asset turns that decision from a gut call into a data-backed one, months before the machine becomes the shop's problem child. If you want to run the numbers before you buy anything, Clue's asset churn and CapEx planning template is free.
Warranty Recovery
This is the one nobody puts on a feature list, and it is real money. Some manufacturers and dealers offer extended coverage for major heavy-equipment components beyond the base machine warranty. When a covered powertrain or aftertreatment component fails, the repair may be expensive enough that missed warranty recovery materially affects equipment cost. Coverage and claim values vary by manufacturer, model, contract, and region.
The claim is lost the same way every time. A machine goes down, the shop fixes it fast because the job needs it, and nobody checks coverage until the invoice is already posted. A maintenance platform that flags warranty status when a work order opens and preserves the service history can help the team identify potentially recoverable repair costs and assemble supporting evidence. The platform does not guarantee reimbursement; eligibility, documentation, and the manufacturer’s warranty terms determine whether a claim is approved.
How to Calculate Which Feature Matters Most for Your Fleet
The seven-feature ranking above assumes every operation looks the same. Most do not. A single-site fleet running its own shop has a different bottleneck than a multi-division contractor that outsources service to dealers. The calculation below adjusts for those differences using the formula and tables that follow.
Step 1: Start with the Base Scores
Each feature is scored 1 to 5 against five weighted criteria: downtime impact (30%), workflow dependency (25%), frequency of use (15%), data leverage (15%), and operational consequence (15%).
| Feature | Score | Share |
|---|---|---|
| Preventive maintenance | 4.85 | 16.96% |
| Work order management | 4.60 | 16.08% |
| Inspection-to-work-order | 4.30 | 15.03% |
| Telematics | 4.00 | 13.99% |
| Parts management | 3.85 | 13.46% |
| ERP integration | 3.70 | 12.94% |
| Maintenance analytics | 3.30 | 11.54% |
Total of all seven scores: 28.60.
Step 2: Adjust for Your Operation
| Your Profile | Adjustment |
|---|---|
| Mixed OEM brands | Telematics data +1, ERP data +0.5 |
| In-house shop | Parts frequency +1, Work order frequency +0.5 |
| Outsourced or dealer-serviced | Parts frequency −1, Inspection consequence +0.5 |
| Multiple sites or divisions | ERP consequence +1, Work order workflow +0.5 |
| ERP already in place | ERP data +0.5, ERP workflow +0.5 |
| No ERP yet | ERP workflow −0.5 |
| Mostly field or jobsite repairs | Work order frequency +1, Inspection frequency +0.5 |
| Fleet over 250 assets | Analytics data +1, Analytics consequence +0.5 |
| Fleet under 50 assets | Analytics data −0.5 |
Cap every adjusted score at 5, floor at 1. If two answers touch the same cell, add both deltas before capping.
One deliberate limitation: none of these rules touch preventive maintenance. That is a stated design choice, not an oversight. Trigger-based maintenance scheduling matters at roughly the same weight regardless of fleet size, brand mix, or shop model, so its score holds constant at 4.85 in both profiles below. Its percentage still shifts slightly, because the total pool of points shifts around it.
Step 3: Recalculate
Feature score = (Downtime × 0.30) + (Workflow × 0.25) + (Frequency × 0.15) + (Data × 0.15) + (Consequence × 0.15)
Then normalize: divide each feature's score by the total of all seven, multiply by 100.
Worked example A: multi-site, mixed fleet, in-house shop, ERP in place
400 assets across three yards, mixed Cat and Deere equipment, an in-house shop, Vista already running.
| Feature | Score | Share |
|---|---|---|
| Preventive Maintenance | 4.85 | 16.30% |
| Work Order Management | 4.80 | 16.13% |
| Inspection-to-Work-Order | 4.30 | 14.45% |
| Telematics | 4.15 | 13.95% |
| ERP Integration | 4.13 | 13.87% |
| Parts Management | 4.00 | 13.45% |
| Maintenance Analytics | 3.53 | 11.85% |
ERP integration climbs from second-to-last in the base table to fifth, passing parts management, on the combined weight of the multi-site and ERP-in-place adjustments.
Worked example B: single site, single brand, dealer-serviced, no ERP, 40 assets
A smaller contractor running an all-Cat fleet out of one yard, service handled by the dealer, accounting still on spreadsheets.
| Feature | Score | Share |
|---|---|---|
| Preventive maintenance | 4.85 | 17.12% |
| Work order management | 4.60 | 16.24% |
| Inspection-to-work-order | 4.38 | 15.45% |
| Telematics | 4.00 | 14.12% |
| Parts management | 3.70 | 13.06% |
| ERP integration | 3.58 | 12.62% |
| Maintenance analytics | 3.23 | 11.39% |
The ranking order barely moves, but the reasoning behind it inverts. Parts management drops below telematics, because the dealer holds the inventory. Inspection-to-work-order climbs, because when you do not run your own shop, the inspection record is the handoff. It is the document that tells the dealer what to fix and the evidence that proves what you reported.
Preventive maintenance and work-order management remain the top two in both worked examples. Other fleet profiles may produce different results, so buyers should run the model against their own operation.
Note: This is a proposed evaluation model, not an industry-standard weighting. The base scores and adjustments reflect an editorial framework built around what the underlying capabilities do, not a scored study.
The Bottom Line
A fixed feature list can imply that every operation weighs downtime, workflow, and cost in the same way. The two worked examples above show they do not. Run the calculation against your own operation before you shortlist anything.
Clue is built for the fleet on the other side of that calculation, not the average one. It connects preventive maintenance, inspections, telematics, work orders, parts, and ERP data into one operational record, so whichever feature comes out on top for your fleet, it is not sitting in a system that cannot talk to the other six. Palmetto Corp used that connected view to find $1M in savings.
Related: our guide to the best construction equipment maintenance software compares the leading platforms for 2026.
Frequently Asked Questions
What features should fleet maintenance software include for heavy equipment?
At minimum: preventive maintenance that handles engine-hour, mileage, and calendar triggers independently, inspection-to-work-order automation, telematics integration that normalizes data across brands, mobile work orders that function offline, parts management tied to repairs, ERP connectivity, and asset-level analytics. The order of importance shifts depending on whether you run your own shop and how many sites you operate.
How does fleet maintenance software actually reduce downtime?
It reduces downtime by closing the gaps between steps, not by adding more steps. An inspection failure that becomes a work order automatically, a part that is visible before a technician walks to the bay, and a maintenance trigger that fires on the right basis for each asset all remove delay. Delays in diagnosis, parts, scheduling, and coordination can represent a significant share of downtime, so fleets should measure their own causes.
How long does fleet maintenance software take to implement?
It depends almost entirely on data readiness, not software complexity. Fleets with a clean asset list, known service intervals, and existing telematics accounts can be running in days. Fleets migrating from spreadsheets usually spend the bulk of the timeline cleaning asset records and mapping cost codes before anything is configured. Ask any vendor what their onboarding assumes about your starting data.
Does fleet maintenance software work on rented and leased equipment?
It should, and the handling needs to differ from owned assets. Rented machines accumulate hours against service intervals just like owned ones, but maintenance responsibility often sits with the rental house. A platform that treats every asset identically will either generate work orders your team does not owe or miss the utilization and cost data you need to decide whether to keep renting.
What happens on jobsites with no cell coverage?
This is a practical requirement, not an edge case. Heavy equipment routinely works in river valleys, tunnels, and remote right-of-way with no usable signal. The mobile app needs to capture labor entries, photos, and parts requests offline and sync automatically once the device reaches coverage. Without that, technicians revert to paper notes and the digital workflow breaks exactly where it matters most.
Who owns the telematics data if we switch platforms?
Data ownership, access, and export rights vary by OEM agreement, platform terms, and integration arrangement. Before switching platforms, confirm who controls the data, what can be exported, how the data is authorized and shared, and how long your maintenance and cost history remains accessible after cancellation.
What is the difference between MTBF and availability?
MTBF is total operating time divided by the number of defined failures during the measurement period. Availability measures the proportion of a defined time window during which an asset is usable. Because availability formulas vary, buyers should ask how the platform defines scheduled time, downtime, planned maintenance, and external delays. A buyer evaluating software should check whether both are tracked per asset rather than fleet-wide, since fleet averages can hide one deteriorating machine behind a dozen healthy ones.
Can fleet maintenance software help decide whether to repair or replace an asset?
It can, if it tracks cost-per-hour and reliability trends at the individual asset level over time. A platform that only reports total fleet spend cannot answer this, because it cannot isolate which specific machine is driving the cost. Look for repeat-failure detection on the same component, since that pattern usually appears before the cost pattern becomes significant.

Transform Your Equipment Management