Fleet utilization is the share of a unit's available hours that it operates during a set period. Divide operating hours by available hours, then multiply by 100. A 50-hour weekly target over 14 days gives 100 available hours. A unit that logs 72 operating hours runs at 72%.
The monthly report says the fleet ran at 62%. The controller asks why a second rental loader came in last month. Three owned loaders sat at another job for much of the month. Their engine hours rose during warm-up and while they waited for trucks. The fleet total cannot show which loader was available, which one was working, or which one should move.
One fleet number can hide the cost and use of each unit. The U.S. Government Accountability Office found the same pattern in federal fleets, where weak review processes left underutilized vehicles in service. It can also blend equipment with different shifts, targets, and ways to track hours. A dozer, a generator, and a pickup do not have the same work pattern. Their utilization needs a measure that fits the class and a review that leads to a choice.
This guide covers how to calculate utilization, set class targets, read idle time, and turn a weekly report into fleet decisions. It also shows where construction equipment utilization software fits once that review becomes a weekly habit.
What is Fleet Utilization?
Fleet utilization is the share of a unit's available hours that it operates during a set period. For a contractor, it helps show how ownership costs spread across operating hours, whether rental spend matches site needs, and which capital requests fit actual demand.
Fleet utilization is the rolled-up view across units and equipment classes. Equipment utilization is the view of one unit. Both matter. Use equipment utilization to assess a single unit, then compare units across classes in your construction fleet management review.
A unit can be available and still not be utilized. Availability asks whether the unit is ready to work. Utilization asks how much of that ready time it worked. The gap between the two is where ownership cost sits with nothing to show for it.
How to Calculate Fleet Utilization
To calculate fleet utilization, divide a unit's operating hours by its available hours for the period, then multiply by 100. Available hours come from the weekly target for that unit, divided by 7, multiplied by the days in the period. For the whole fleet, add operating hours across units and divide by their combined available hours.
Start with hours for one unit over a clear period. Use engine hours as operating hours when that is the data you have. Then compare them with available hours based on a target for that unit or its class.
Fleet Utilization Rate (%) = (Operating Hours ÷ Available Hours) × 100
Available Hours = (Weekly Target Hours ÷ 7) × Days in the Period
Example: An excavator has a 50-hour weekly target. Over 14 days, it has 100 available hours. It logs 72 engine hours.
72 ÷ 100 × 100 = 72%
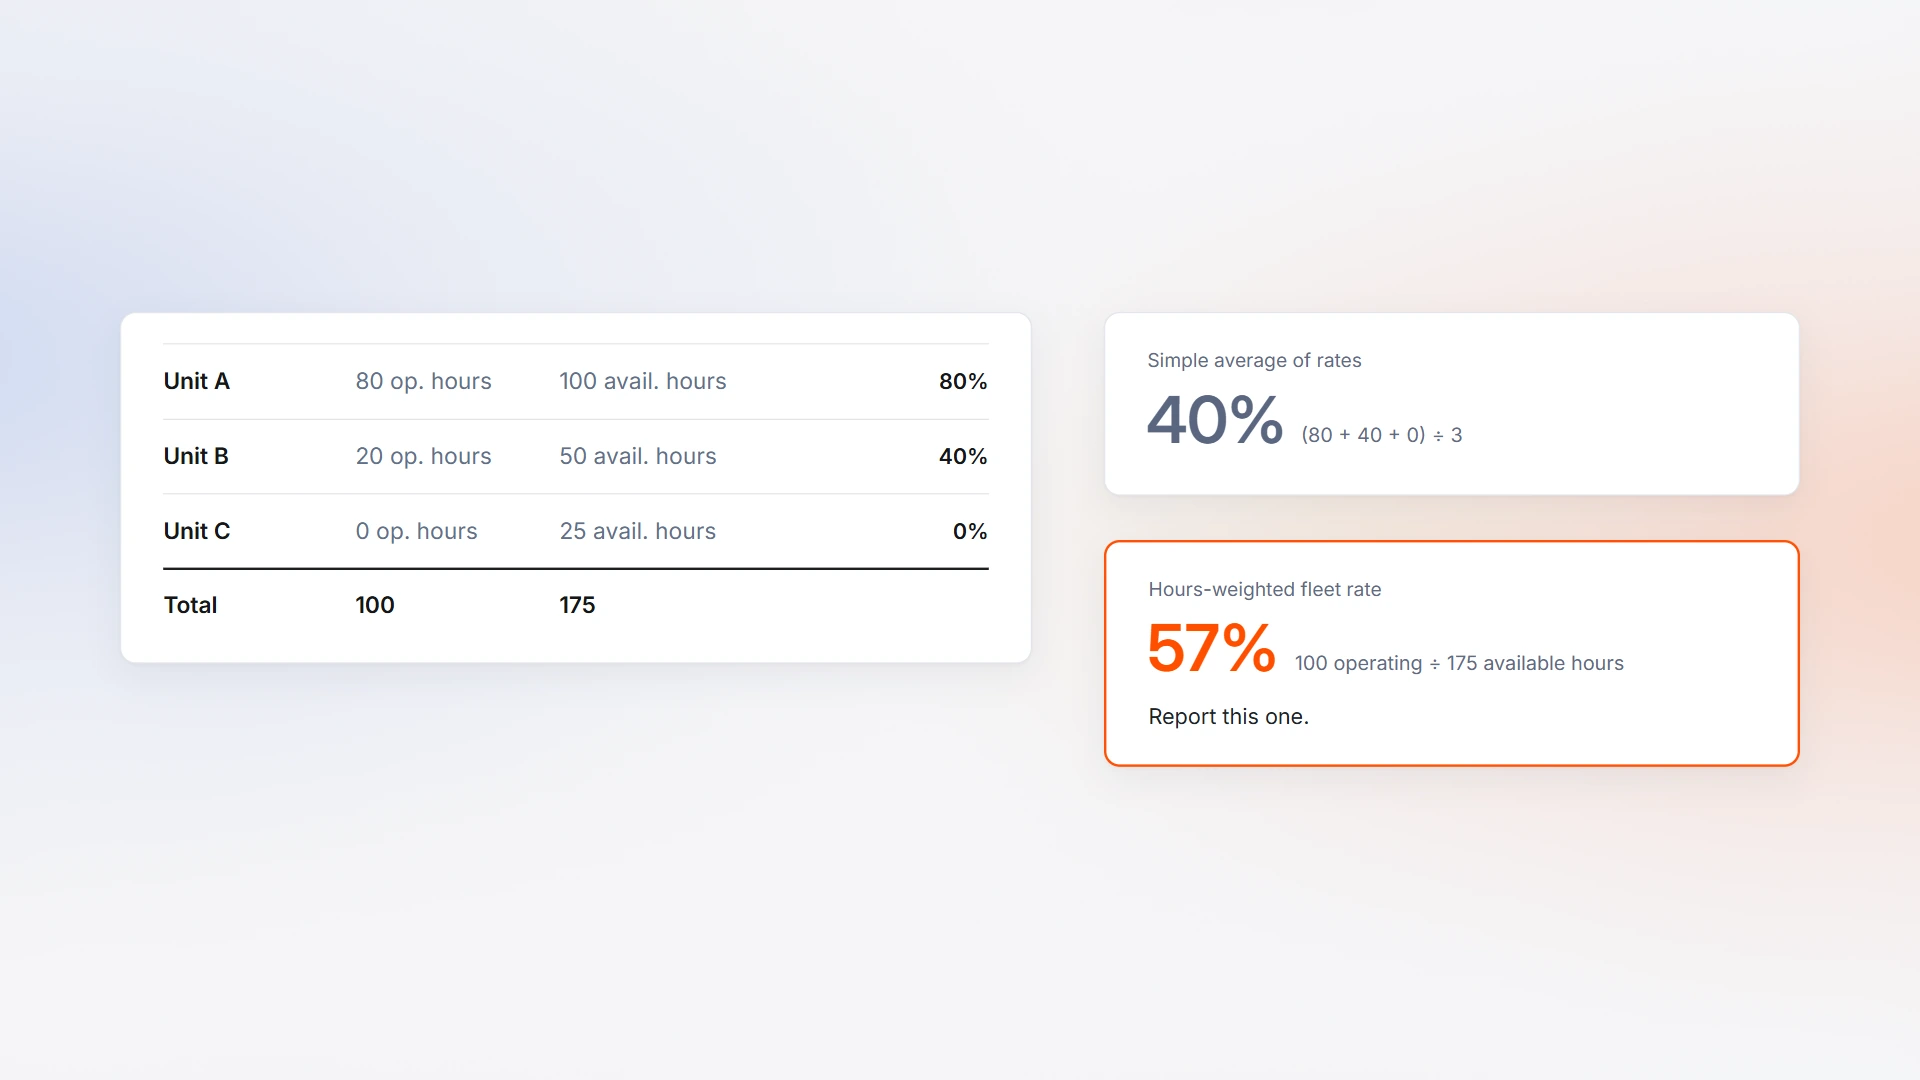
To roll up the fleet, add operating hours across the units. Add their available hours. Divide the first total by the second. This gives each hour the same weight, even when units have different targets or periods of availability. It is a useful way to compare construction fleet metrics across a mixed fleet.
Three-unit example:
| Unit | Operating Hours | Available Hours | Utilization |
|---|---|---|---|
| A | 80 | 100 | 80% |
| B | 20 | 50 | 40% |
| C | 0 | 25 | 0% |
| Total | 100 | 175 | 57% |
The simple average is 40%. The hours-weighted fleet figure is 57%. Report 57% as the fleet rate because it reflects the share of all available hours that units operated.
Keep class and unit rates alongside it. A fleet total can still hide differences that matter to your next move. For a related view of capacity utilization, define what capacity means for the equipment and shift you are measuring.
How to Measure Fleet Utilization: 4 Methods
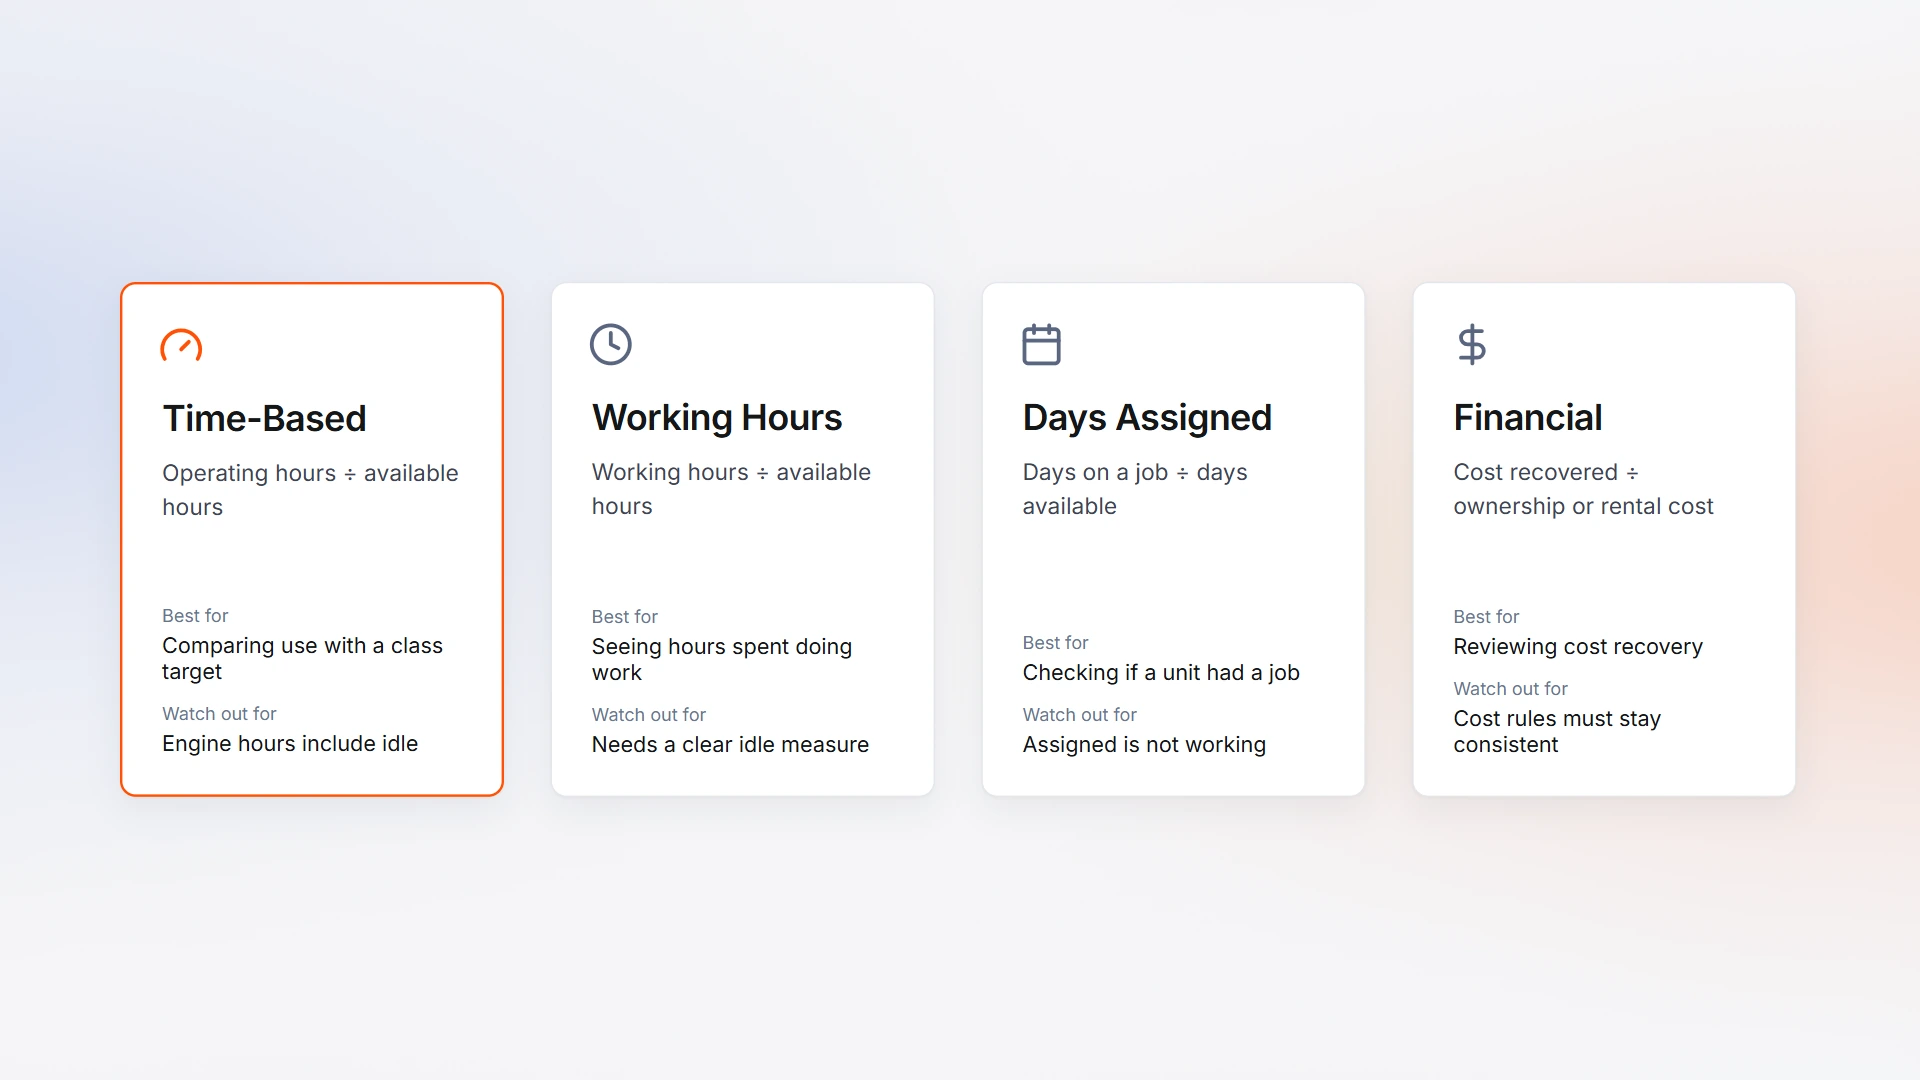
There are four ways to measure fleet utilization: time-based on engine hours, working-hours after idle is removed, days-on-rent or days-assigned, and financial utilization against cost recovered. Each one answers a different question. Pick the one that matches how the equipment is scheduled and billed.
Choose a method that answers a clear question. A unit's equipment utilization report can show hours and support decisions at the unit level.
| Method | Formula | Best For | Watch Out For |
|---|---|---|---|
| Time-Based (Hours) Utilization | Operating hours ÷ available hours | Comparing use with a class target | Engine hours include idle |
| Working-Hours Utilization | Working hours ÷ available hours | Seeing hours spent doing work | Working hours need a clear idle measure |
| Days-on-Rent or Days-Assigned Utilization | Days on a job ÷ days available | Checking if a unit had a job. Also reported as days used. | A full day assigned does not mean a full day working |
| Financial Utilization | Revenue or billed cost recovered ÷ ownership or rental cost | Reviewing cost recovery | Cost and revenue rules must stay consistent |
Fleet Utilization Metrics to Track
The core fleet utilization metrics are utilization rate by equipment class, idle rate, working hours, zero-hour units, units under target, rental utilization, and cost per operating hour. Together they connect a unit's hours to a decision. Track them by class and by unit, not as one fleet number.
Track a small set of measures that connects unit hours to a decision. These fleet management KPIs work best when you review them by class and by unit, and they are the measures equipment utilization software is built to report.
1. Utilization Rate by Equipment Class: See Where Hours Go
What it shows: How much of each class's available time is in use. Compare dozers with dozers, rather than with light towers.
How to calculate it: Add operating hours for the class, then divide by its available hours.
What to do with it: Compare the class rate with its target. Review the units that pull the rate down.
2. Idle Rate: Find Engine Hours Spent Waiting
What it shows: The share of operating hours when a unit is on but not working.
How to calculate it: Idle Rate (%) = (Idle Hours ÷ Operating Hours) × 100
What to do with it: Check the reason for idle time at the site. Separate normal warm-up from time spent waiting for trucks or an operator.
3. Working Hours: See Time Spent on the Task
What it shows: The hours when a unit is doing work, after idle time is removed. This adds context to engine hours.
How to calculate it: Operating Hours − Idle Hours.
What to do with it: Compare working hours with the planned shift. Review site conditions if engine hours rise while working hours stay flat.
4. Zero-Hour Units: Find Equipment With No Use
What it shows: Units with no operating hours during the review period. They may be spare, parked, out of service, or missing a reading.
How to calculate it: Count units with zero operating hours in the period.
What to do with it: Confirm location and condition. Decide whether to keep it available, move it, or put it through a condition review.
5. Units Under Target: Focus the Weekly Review
What it shows: Units using a smaller share of available hours than the target you set. Below 40% of target is one example. The threshold is your fleet's choice.
How to calculate it: Compare each unit's utilization rate with its target threshold.
What to do with it: Check the job plan, availability, and rental demand. Give each flagged unit a next step.
6. Rental Utilization: Compare Rented and Owned Units
What it shows: Whether rented equipment is being used while an owned unit of the same class is available. The rental reports can help you check the rental period and site assignment.
How to calculate it: Compare operating hours with available hours for rented units. Compare the same class of owned equipment over that period.
What to do with it: Confirm the work need at both sites. Consider a move or rental return when the schedules allow.
7. Cost per Operating Hour: Put Cost Beside Use
What it shows: How ownership or rental costs relate to the hours a unit operates. This helps when you weigh units with different work histories.
How to calculate it: Unit cost for the period ÷ operating hours for that period.
What to do with it: Review cost and condition with the use pattern. Use an equipment cost audit when a unit's cost needs a closer look.
How to Set Utilization Targets by Equipment Class
Set targets from the planned shift, not from a single fleet-wide number. Start with hours per day multiplied by working days in the period. Adjust the target for the class and how it is assigned. Review targets each quarter as job plans and shifts change.
| Equipment Class | How It Usually Works | How to Set the Target |
|---|---|---|
| Production equipment: excavators, dozers, loaders | Works during planned production shifts | Use planned shift hours and days. Adjust for moves and expected standby time. |
| Haul trucks: articulated haul trucks, water trucks | Work in cycles tied to loading, haul roads, and site flow | Base the target on planned operating hours. Review cycle delays separately. |
| Support equipment: rollers, compactors, skid steers, telehandlers, boom lifts | Moves between tasks and may serve several crews | Use the planned hours for assigned work. Review how often it changes tasks. |
| Generators, pumps, and light towers | Can run around the clock when site needs require it | Use the expected run schedule. A unit planned for 24 hours needs a different target from a dozer on a 10-hour shift. |
| Attachments and small tools | Often have no engine hours | Use days assigned, task records, or another measure that fits the work. |
There is no published benchmark that fits every contractor. The right rate depends on equipment class, shift pattern, and whether the measure counts idle time. What you can set is a threshold for action. Pick a band for each class, then give each band a standing decision.
| Utilization vs Class Target | What It Usually Means | Standing Decision |
|---|---|---|
| 0% for the period | Parked, out of service, or a missing hour reading | Confirm location and condition before any other step |
| Below 40% of target | More unit than the job needs right now | Redeploy it, return it, or review it for sale |
| 40% to 70% of target | Working, with room in the schedule | Check the job plan before adding a rental of the same class |
| Above 70% of target | Carrying its share of the work | Protect the service window so it stays available |
| Above target with no service window | At risk of unplanned downtime | Schedule service inside a low-demand window |
These are starting bands, not an industry standard. Set them per class, then review them each quarter as job plans change. The U.S. General Services Administration takes the same position for federal fleets: agencies set their own documented utilization criteria rather than apply one number across the fleet.
Does Idle Time Count as Fleet Utilization?

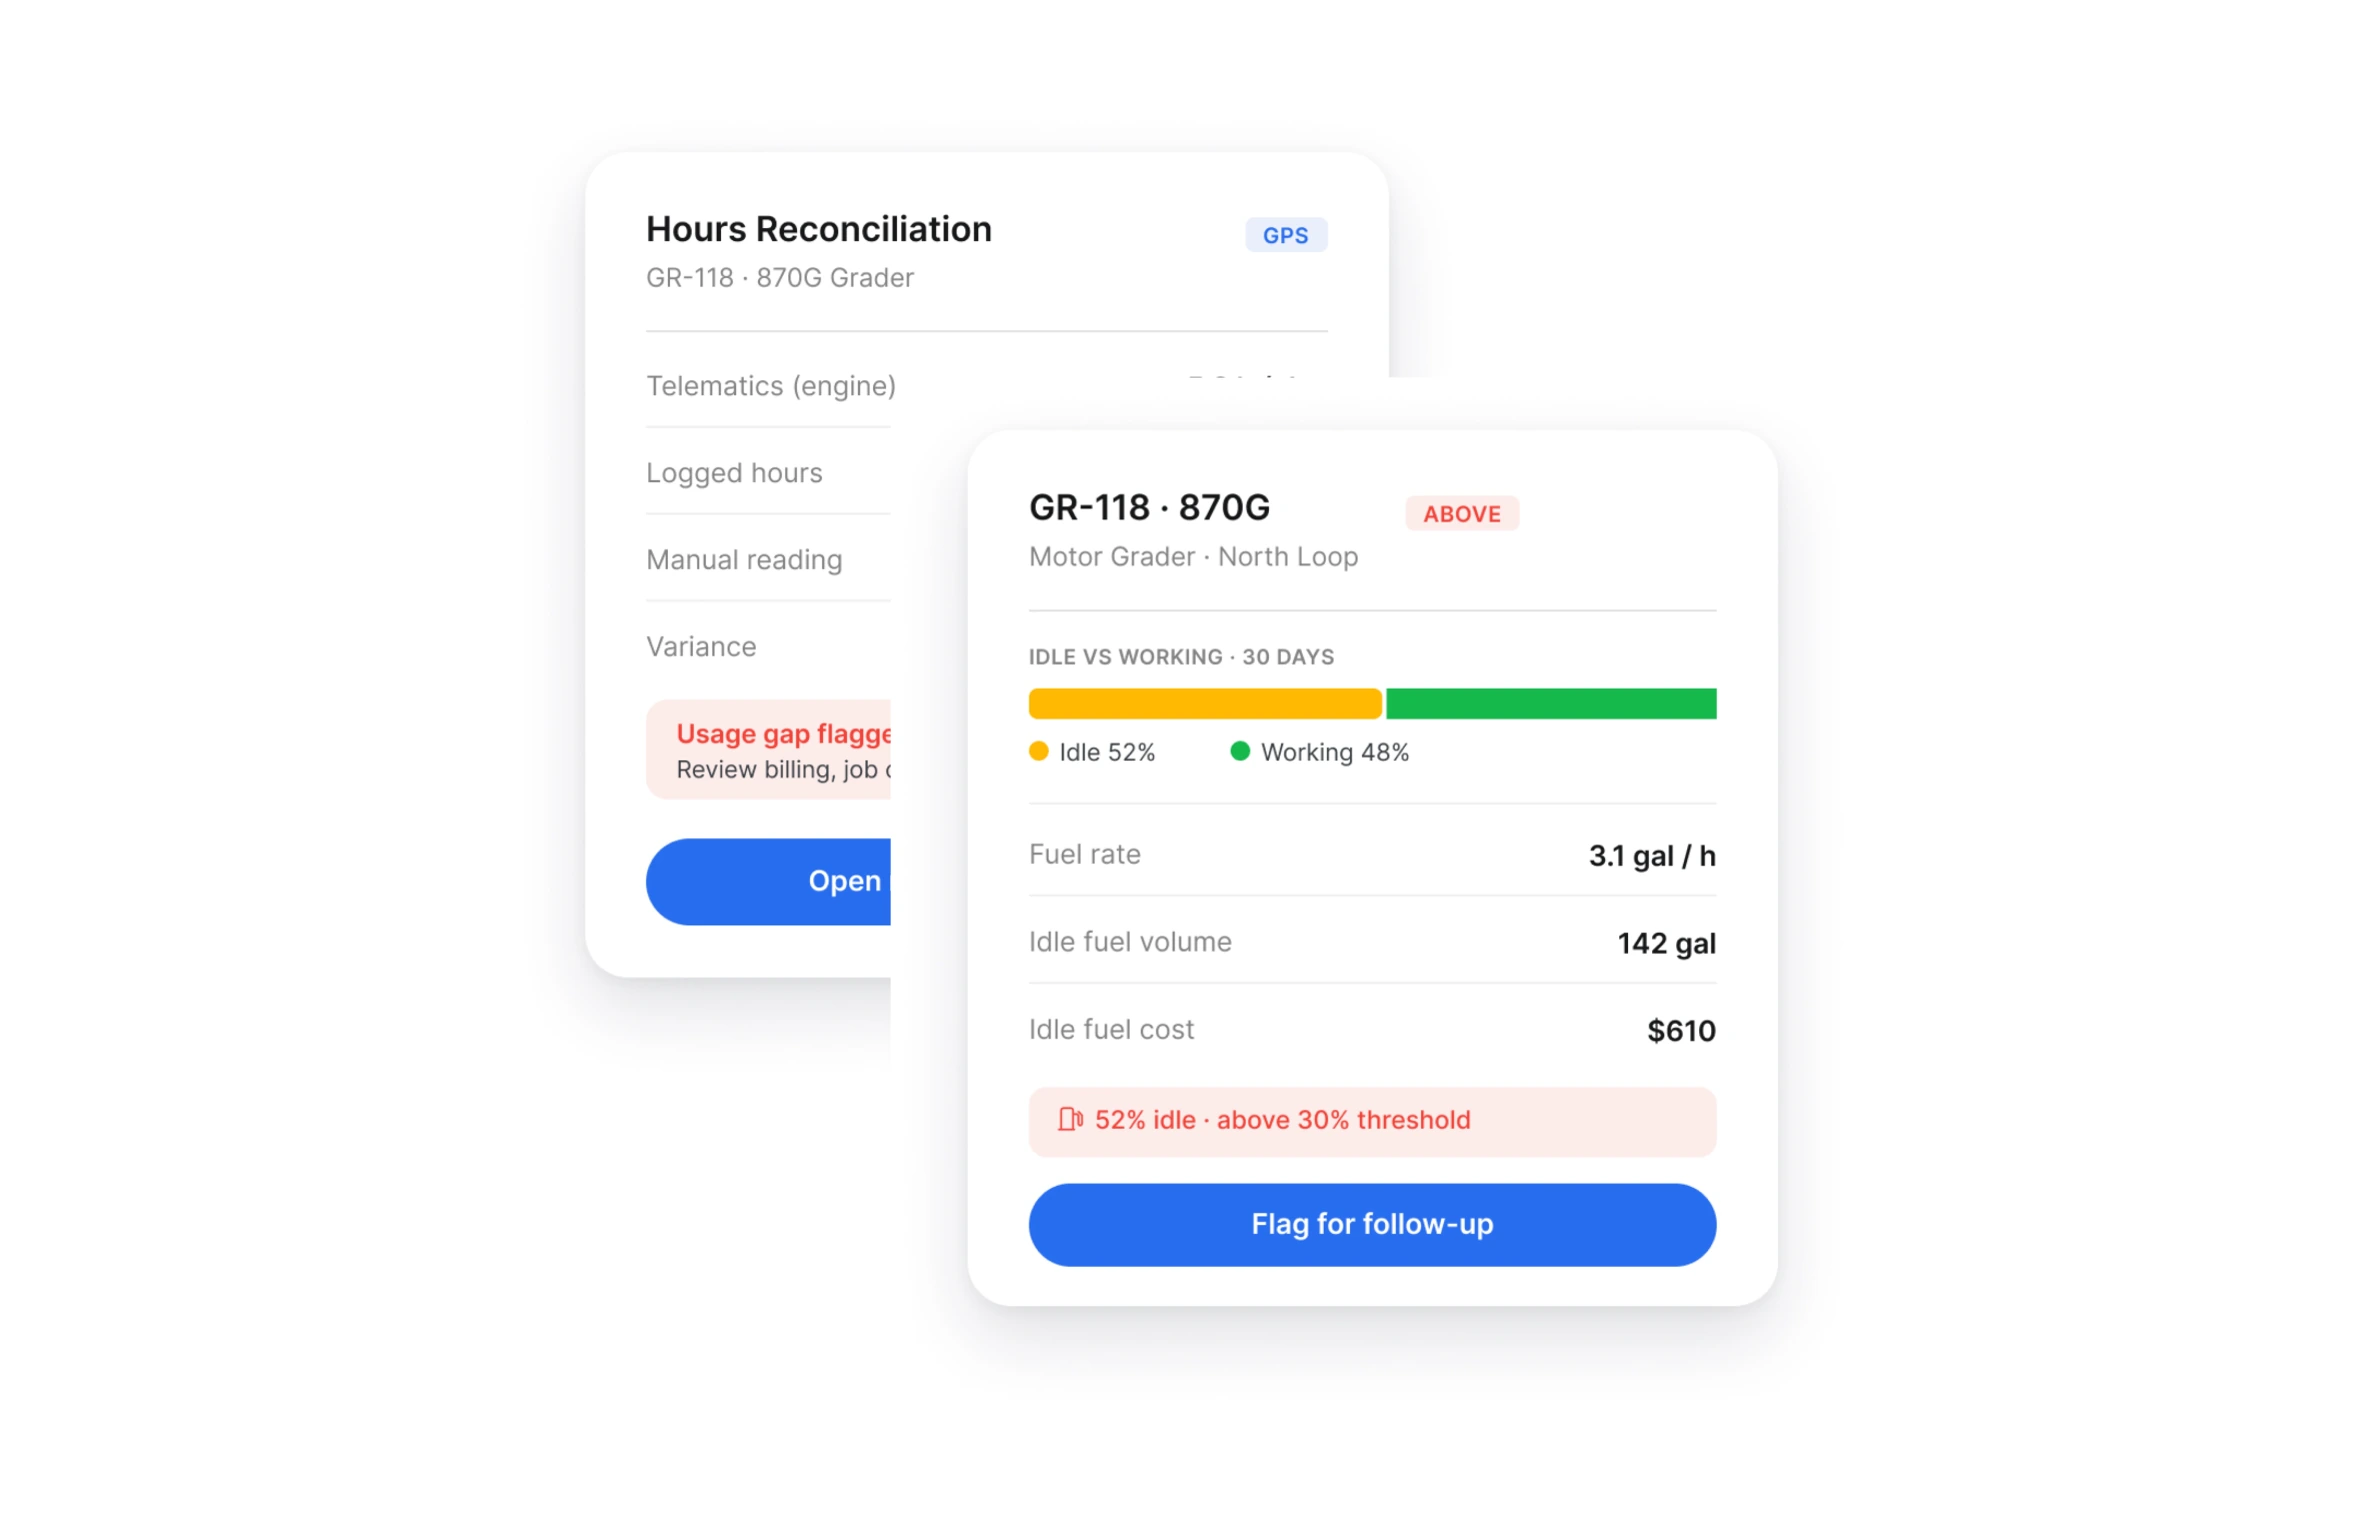
Idle time counts as utilization whenever your operating hours come from engine hours. The engine is on, so the meter runs, even though the unit is doing no work. That is why a time-based rate can look healthy while the job gets nothing from the unit.
Engine hours include time when the engine is on. That can make a unit look busy while it burns fuel and hours without doing work. Common causes include warm-up and cool-down, waiting for trucks, and operators leaving a unit running between tasks. The U.S. Department of Energy, citing Argonne National Laboratory, puts idling across all US road vehicles at more than 6 billion gallons of fuel a year. That figure covers cars through heavy trucks, not job sites. The same idle reduction research explains why the hours still cost you on site.
Use working hours alongside operating hours to see the difference:
Utilization Without Idling (%) = ((Operating Hours − Idle Hours) ÷ Available Hours) × 100
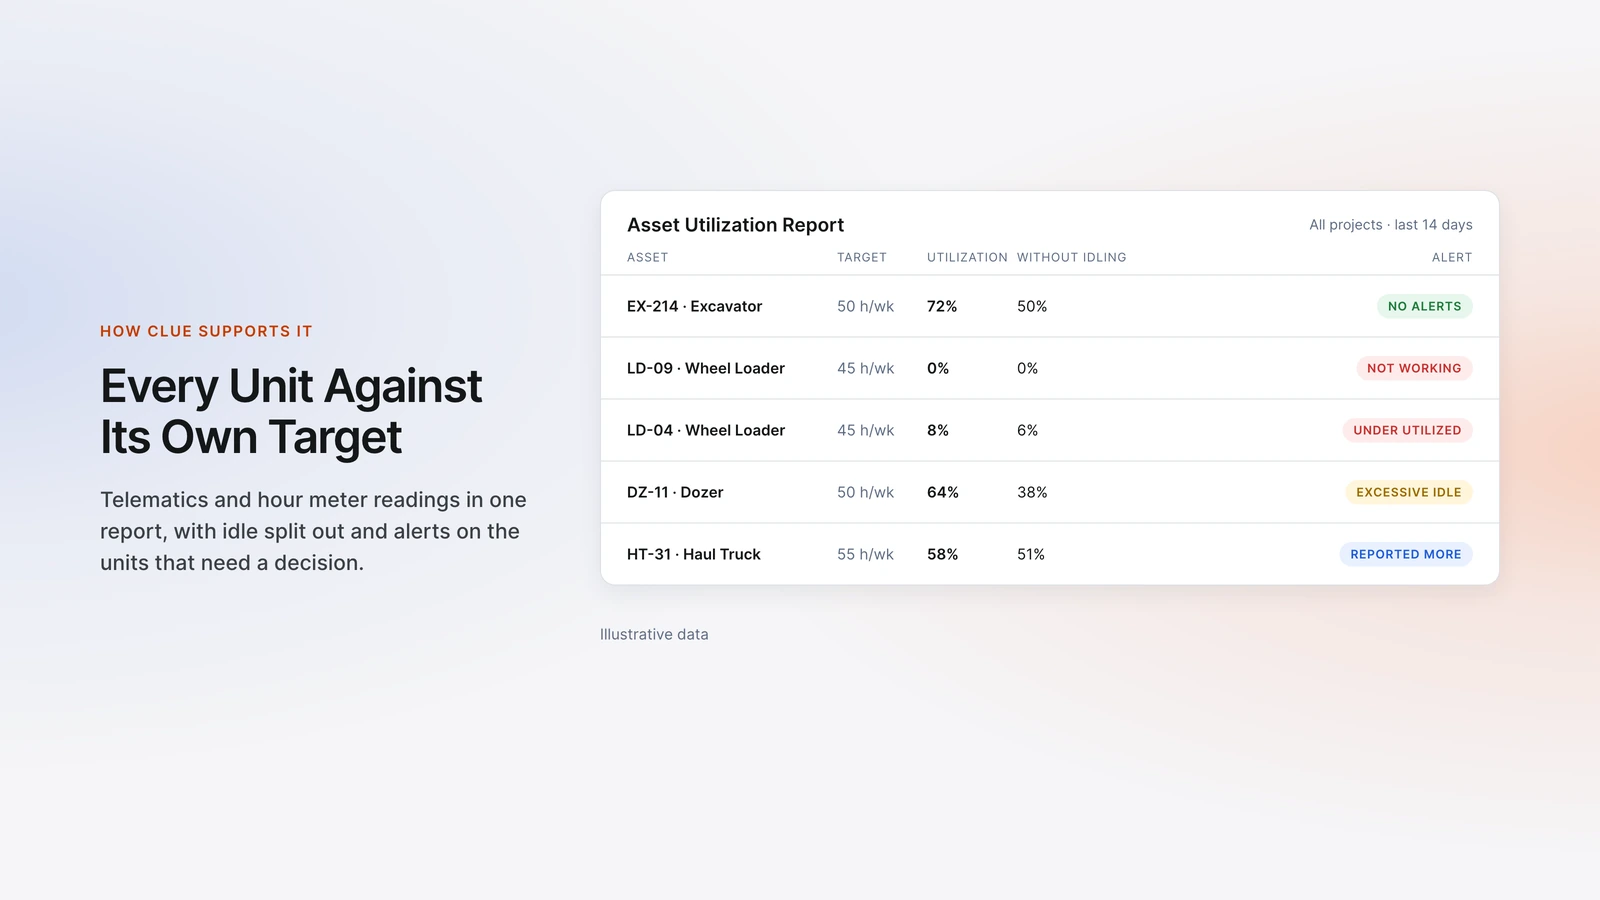
Example: A unit has 72 operating hours and 22 idle hours. It has 50 working hours. Against 100 available hours, utilization without idling is 50%. The time-based rate was 72%.
Idle fuel cost can be estimated as idle fuel used × fuel price. Use recorded idle fuel where available, then apply the price you use for your cost review. Heavy equipment telematics can help show engine and idle hours. Mixed fleet telematics in one platform can bring readings together when equipment uses different tracking sources.
How to Improve Fleet Utilization
To improve fleet utilization, put every unit in one report, check owned equipment before approving a rental, move low-use units between jobs each week, return rentals that sit, cut idle time at the source, schedule service in low-demand windows, retire units that stay low across several periods, and bring utilization data into capital requests.
A weekly review gives you a regular time to act on the numbers. These steps connect unit use with job plans, rentals, and equipment life. Each one ends in the same four choices: redeploy, return, dispose, or retain as spare.
1. Get Every Unit Into the Same Report
Include tracked and untracked units in the review. For equipment without telematics, enter hour meter readings on a schedule. A shared view lets you compare the whole fleet.
2. Check Owned Units Before You Rent
Before confirming a rental, check owned units of the same class. Confirm their location, condition, and schedule. A unit that is free on paper may already be committed to another job.
3. Move Low-Use Units Between Jobs Weekly
Compare low-use units with work planned at nearby sites. Confirm transport, timing, and site needs before you move one. A clear equipment scheduling plan helps teams see where each unit is assigned.
4. Return Rentals That Sit
Review rental hours and days assigned each week. Check the return terms and confirm that work at the site is covered before ending the rental. Keep rental dates and unit use in the same view.
5. Cut Idle Time at the Source
Talk with operators and site leads about when units run without doing work. Set warm-up rules and a shutdown policy that fit the equipment and job conditions. Keep the focus on clear work habits at the site.
6. Plan Maintenance Around Low-Use Windows
Use lower demand periods to schedule service where the work plan allows it. This can keep planned maintenance separate from hours needed on site. It also protects preventive maintenance compliance, since the service falls due in a window the job can spare. Review equipment downtime with planned work and service records.
7. Right-Size the Fleet Against Real Demand
Right-sizing matches the fleet you own to the work you actually have. Look at utilization by class across several periods, not one month. Count how many units of a class sit below target at the same time. That number is your spare ratio, and it tells you how many units the fleet can release without putting a job at risk. The U.S. Department of Energy covers the same method in its guidance on fleet right-sizing.
8. Sell or Retire Chronic Low-Use Units
Look across several review periods before making a disposal decision. Check condition, expected work, replacement needs, and ownership costs. Equipment lifecycle management helps frame the choice over the unit's full working life.
9. Use Utilization Data in Capital Requests
Show the class target, current use, and units already available when you prepare a request. Include upcoming work and the reason existing units cannot cover it. A clear equipment budget review can connect the request with fleet costs.
Worked Example: Moving One Low-Use Loader Instead of Renting
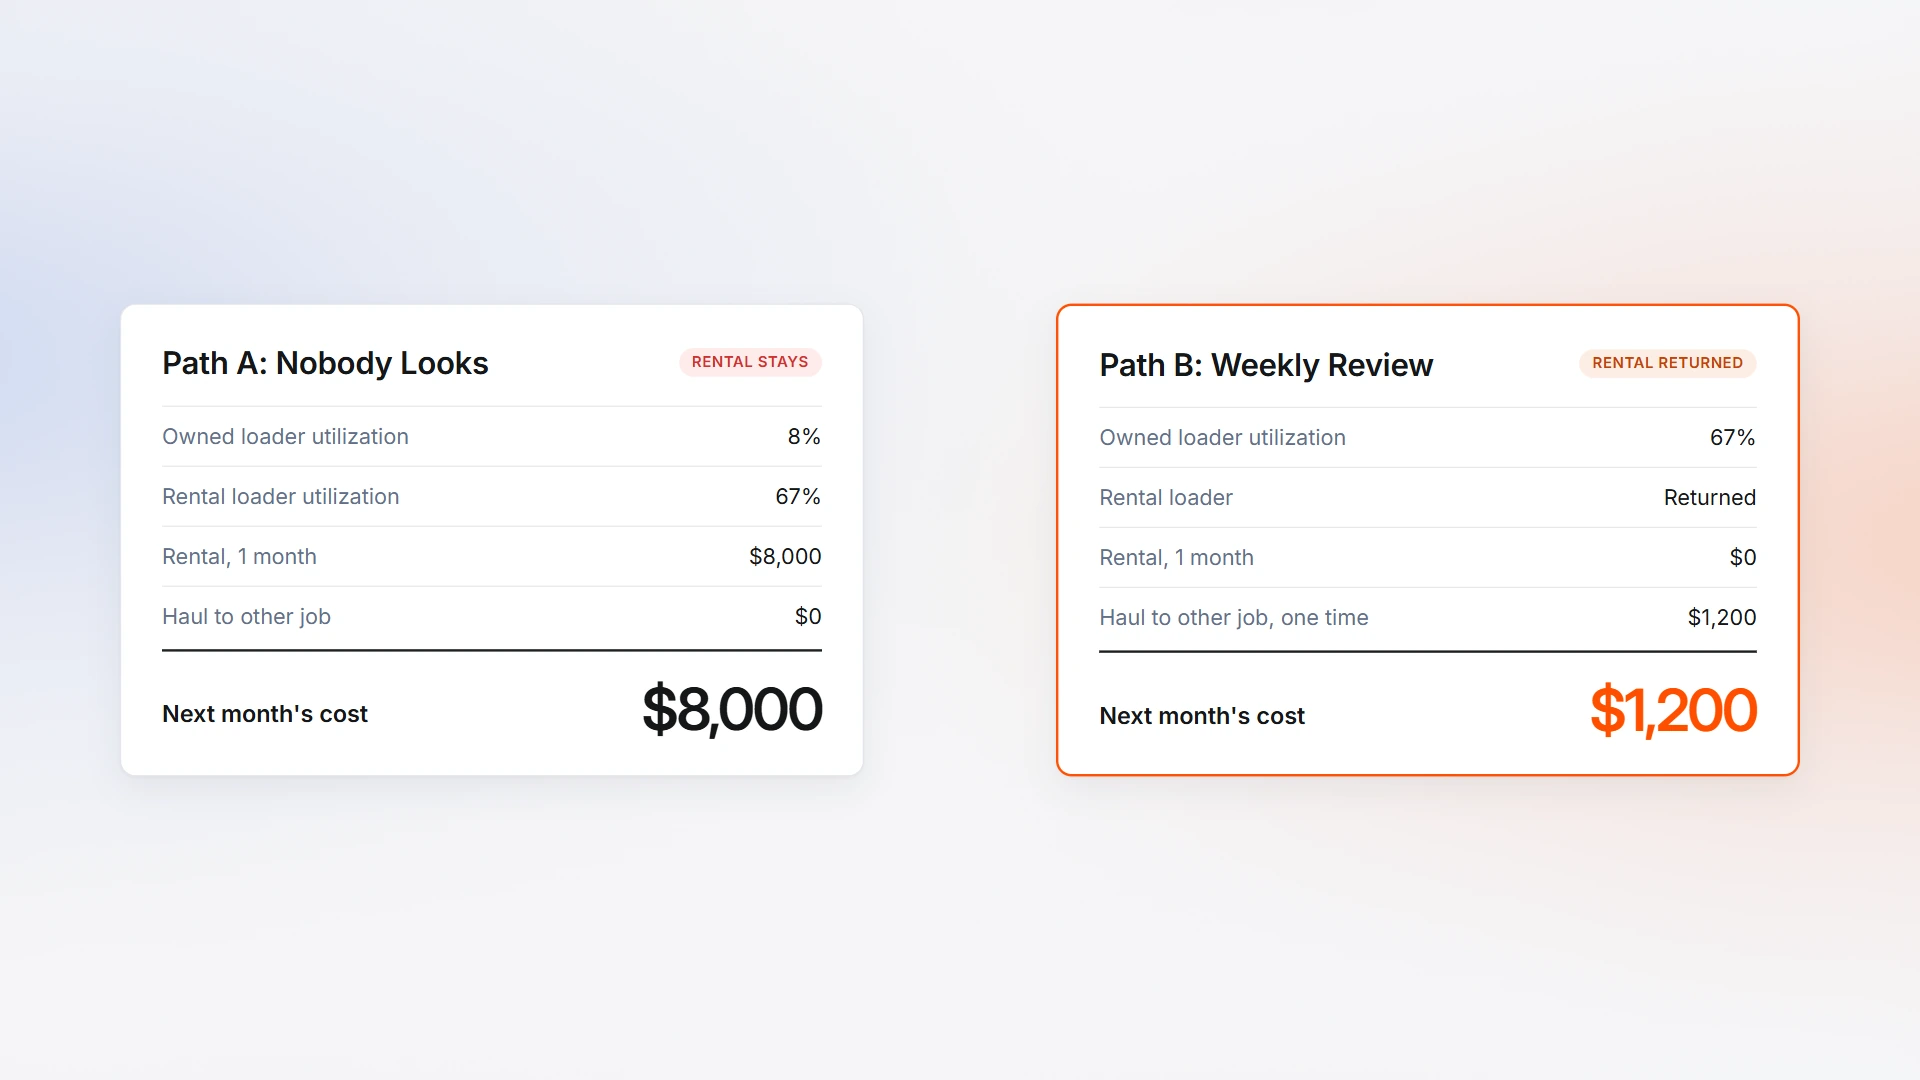
The inputs: A contractor owns a wheel loader with a 45-hour weekly target. Over four weeks, it runs 14 hours against 180 available hours. Its utilization is 14 ÷ 180, or about 8%. A rented loader of the same class runs 120 hours against 180 available hours on another job. Its rate is about 67%.
Path A: No one reviews both units. The rental continues for another month at an $8,000 monthly rate. The owned loader stays at its current job and keeps its ownership cost. The rental remains busy at the other site.
Path B: The weekly review flags the owned loader. The contractor confirms its condition and moves it to the other job. The rental is returned. In the next four-week period, the owned loader runs 120 hours against 180 available hours. Its rate is about 67%. The rental is off the books.
The one-time haul cost is $1,200. One month of avoided rent is $8,000. Subtracting the haul cost leaves $6,800 before ownership costs, taxes, or other charges. If the move only saves two weeks of rent, the rent avoided is $4,000. After the $1,200 haul, $2,800 remains before those other costs.
The rates in this example stand in for your own. Run the same arithmetic on last month's hours.
Weekly Fleet Utilization Review
| Signal | What It Usually Means | Action | Who Decides |
|---|---|---|---|
| Zero hours all week | Unit may be parked, out of service, or missing a reading | Check location, condition, and hour reading | Equipment manager with site lead |
| Below target 3 weeks running | Work may have shifted or the unit may be in the wrong place | Check the schedule, then redeploy or retain the unit | Fleet manager with operations |
| Above target and rentals of the same class on site | Owned unit may cover work currently assigned to a rental | Confirm job needs, then return the rental if possible | Operations and rental lead |
| High idle rate | Engine hours may include long waits or running between tasks | Review site causes and coach the operator | Site lead |
| Reported hours do not match telematics hours | Manual reading or tracker data may need review | Check the meter, then fix the meter entry or tracker | Equipment manager |
Common Fleet Utilization Mistakes
- One target for every unit: A generator that can run through the night has a different schedule from a dozer on a planned shift. Set a target for the class and its expected work.
- Using 24 hours a day as the denominator: Available hours should reflect the target and period. A full day is not automatically a full day of planned work.
- Counting idle as work: Engine hours can include warm-up, waiting, or time between tasks. Track working hours beside operating hours.
- Leaving units without telematics out of the report: Enter meter readings on a schedule so untracked equipment stays part of the fleet view.
- Confusing availability with utilization: A unit can be ready to work all month and still log no hours. Report both so the gap is visible.
- Reporting the number without a decision attached: Add a next step for units below target, above target, or not working. The costs of underutilized equipment are easier to review when each unit has a clear status and action.
How Clue Supports Fleet Utilization
The Asset Utilization Report combines telematics data with manual hour meter readings. Units with and without telematics appear in one report. Clue pulls engine hours and ECM hours from GPS, OEM, and telematics sources, with 80+ integrations, including feeds that follow the ISO 15143-3 (AEMP) telematics standard.
The report calculates Utilization Rate as Operating Hours ÷ Available Hours × 100. Available Hours use the weekly utilization target divided by 7, then multiplied by days in the range. Each unit has a weekly target, defaulted by asset type and editable per asset.
The report shows operating hours, idle hours, working hours, idle rate, idle fuel used, estimated cost of fuel burned while idling, and Utilization Rate Without Idling. Alert statuses flag Not Working for zero hours, Under Utilized below a configurable threshold with a 40% default, Excessive Idle Rate, and Reported More or Reported Less when manual and telematics hours do not match.
Schedule reports to any email address daily, weekly, or monthly. Filter by asset, equipment type, project, or fleet.
Start Your First Fleet Utilization Review
The three loaders in the opening report may look alike in a fleet total. Their locations, work plans, and idle hours can point to different choices. A class target helps you compare the right units. A weekly review helps you act while the job plan can still change.
This week, pull last month's hours by class. List every unit under target, then add a decision beside it. Redeploy, return, dispose, or retain as spare.
If Clue is on your shortlist, book a demo and bring last month's utilization report.
Frequently Asked Questions
What Is Fleet Utilization?
Fleet utilization, written fleet utilisation outside the US, is the share of available hours that equipment operates during a set period. Contractors can calculate it for a unit, a class, or the fleet. The result depends on how you define operating hours and how you set available hours for each unit.
How Do You Calculate Fleet Utilization?
Divide operating hours by available hours, then multiply by 100. Set available hours from a weekly target and the days in the period. For the fleet rate, add operating hours across units and divide by their combined available hours.
What Is a Good Fleet Utilization Rate?
There is no published rate that fits every contractor. Set a target per equipment class from the planned shift, then use bands for action: zero hours means check the unit, below 40% of target means redeploy it or return it, 40% to 70% means check the job plan before renting the same class. Review the bands each quarter.
What Is the Difference Between Fleet Utilization and Equipment Utilization?
Fleet utilization rolls hours up across multiple units and classes. Equipment utilization describes one unit. The fleet rate helps you see the whole picture. Unit rates help you identify which equipment needs a closer review or a decision.
Does Idle Time Count as Utilization?
Idle time counts when your operating hours include engine-on hours. That can raise the time-based utilization rate even when a unit is waiting. Track idle hours separately and compare working hours with available hours to see how much time went to work.
What Is the Difference Between Fleet Availability and Fleet Utilization?
Availability is the share of time a unit is ready to work. Utilization is the share of that ready time it actually worked. A unit can sit at 100% availability and 0% utilization for a full month. Report both so the gap between ready and working is visible.
How Often Should You Review Fleet Utilization?
Many contractors review utilization weekly to plan moves and rental returns. They review targets and disposal choices quarterly as work plans change. Treat this as a practical review rhythm, then adjust it to match your projects and how often your fleet assignments change.
How Do You Track Utilization for Equipment Without Telematics?
Record hour meter readings on a set schedule, such as during a weekly review. Enter the reading, unit, and date so you can compare changes over time. Add those readings to the same report as telematics hours to include the full fleet.

Transform Your Equipment Management


