Understanding Home Screen Widgets
Once you've logged into CLUE you'll see the home screen. This page provides important insights into your fleet's performance and health through interactive widgets.
Performance
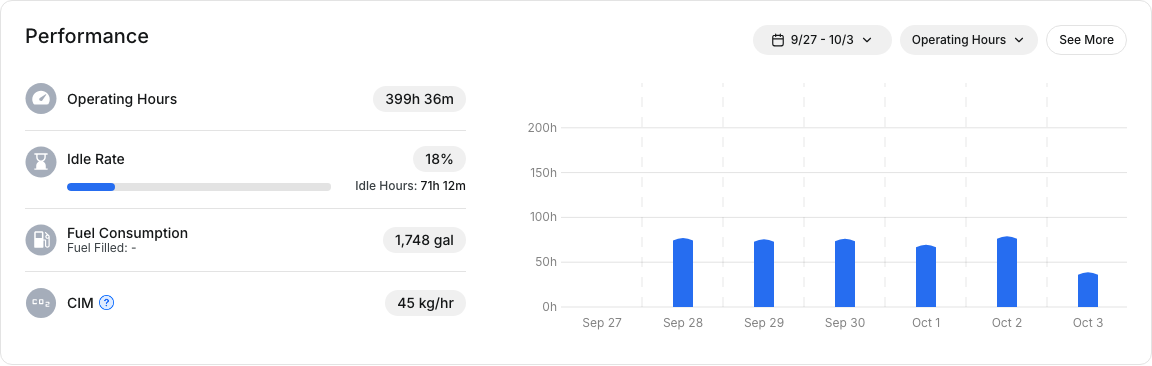
The Performance widget shows key operational metrics:
- Operating Hours - Total engine hours across your fleet
- Idle Rate - Percentage of time equipment is idling vs. working
- Fuel Consumption - Total fuel used (gallons)
- CIM (Carbon Impact Metric) - Environmental impact tracking
To the right of that information you will see a bar chart that you can use get a representation of those values over ranges of time. Use the date range selector to select the range of time you'd like to view the data for. You can also use the dropdown menu next to the date range selector to change the metri
Asset Insights
The Asset Insights widget provides status cards showing the health of your fleet.
- Issues Reported - Equipment with inspection issues
- Good Standing - Assets with no current issues
- Under Utilized - Equipment below usage targets
- Need Inspection - Assets requiring inspection
- Left Geofence - Equipment outside boundaries
- Excessive Idling - High idle time alerts
- No Activity - Equipment with no recent activity
You can click on any of the cards to see a list of affected assets.

Fault Codes
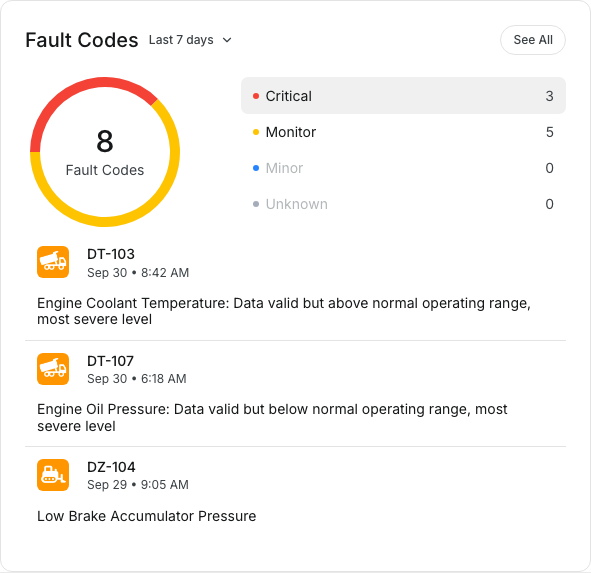
The Fault Codes widget displays active fault codes by severity:
- Critical - Immediate attention required
- Monitor - Watch closely
- Minor - Schedule for service
- Unknown - Unclassified codes
Click the See All button to view the full list of Fault Codes.
Work Orders
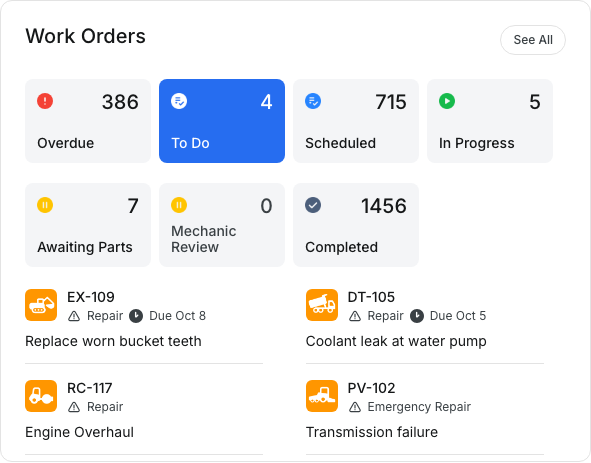
The Work Orders widget provides you with a quick overview of your work orders and their statuses. Each card shows a count of work orders in the given status. You can click on any of the cards to view all work orders in that status. Below the cards you can see a list of recently modified work orders. Clicking on of them will show you the work order in more detail. You can also click on the See All button in the upper right corner of the widget to go to the page where all of your work orders will be listed.
Inspection Issues
The inspection Issues widget displays a bar chart which breaks down the inspect issues your fleet has experienced during the current day. You can use the dropdown menu next to the widget heading to choose the last seven days. To the right of the bar chart you can select one of the severity levels to show inspection issues with that severity level underneath the bar chat. From there you may click on any one of the items to see the inspection issue in more detail. Clicking on the See All button in the upper right corner of the widget will direct you to a page where you can view all inspection issues.

Directories
The Directories widget shows your assets and people that apart of your CLUE organization. You can switch between views by clicking either button. In each view you can click on an asset or person to see more information. Clicking on the See All button will show you all of your assets or people depending on which view you were on when you clicked on the See All button.

Map View
The map widget shows you your projects and geofences overlayed on a map view. You can zoom in and out and pan left to right to view different parts of the world. Hovering your mouse cursor over a project (white folder icon on a green background) will show a pop up which you can then click on to get more information about the project. You can also click on the See All button to go to the Track Everything page.

Tips
- Check the Home screen daily for an overview of the health of your fleet.
- Address Critical fault codes immediately!
- Review Under Utilized assets within the Asset Insights widget to optimize your fleets allocation.
- Use the Asset Insights widget to prioritize maintenance activities.