Navigating the CLUE Dashboard
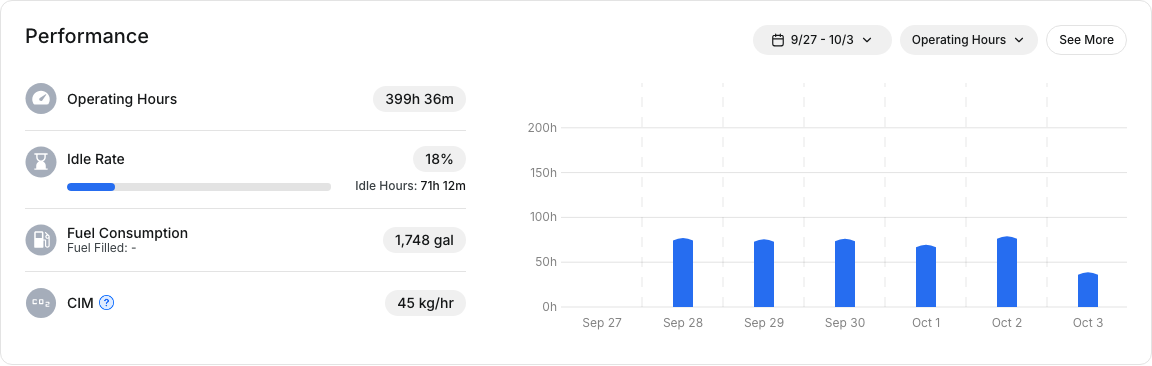
The CLUE dashboard is your central hub for managing fleet operations. As such it's important to learn how to effectively navigate through it.
The Sidebar Menu
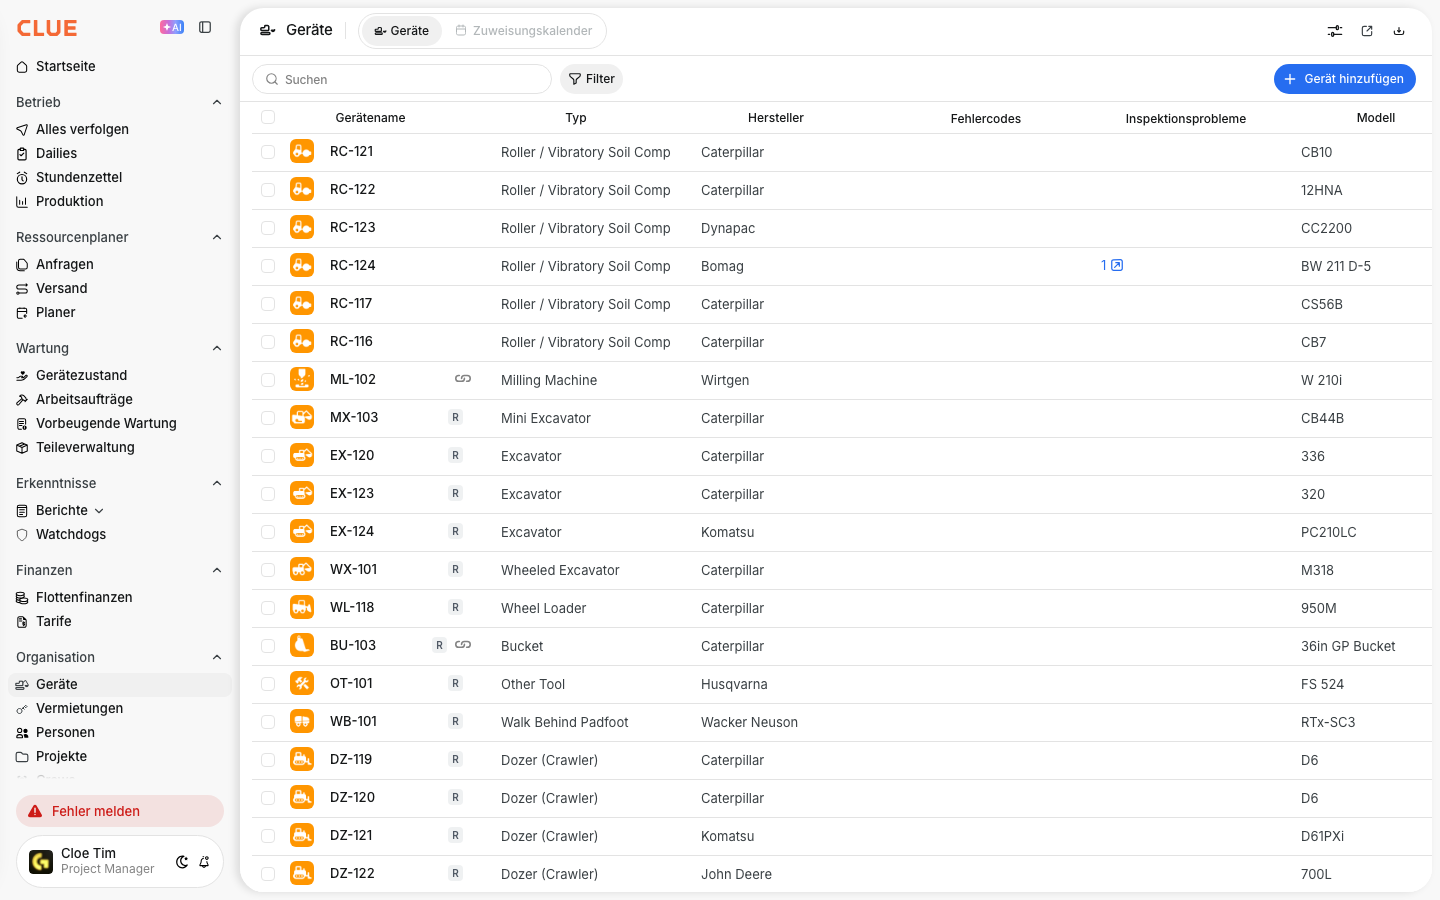
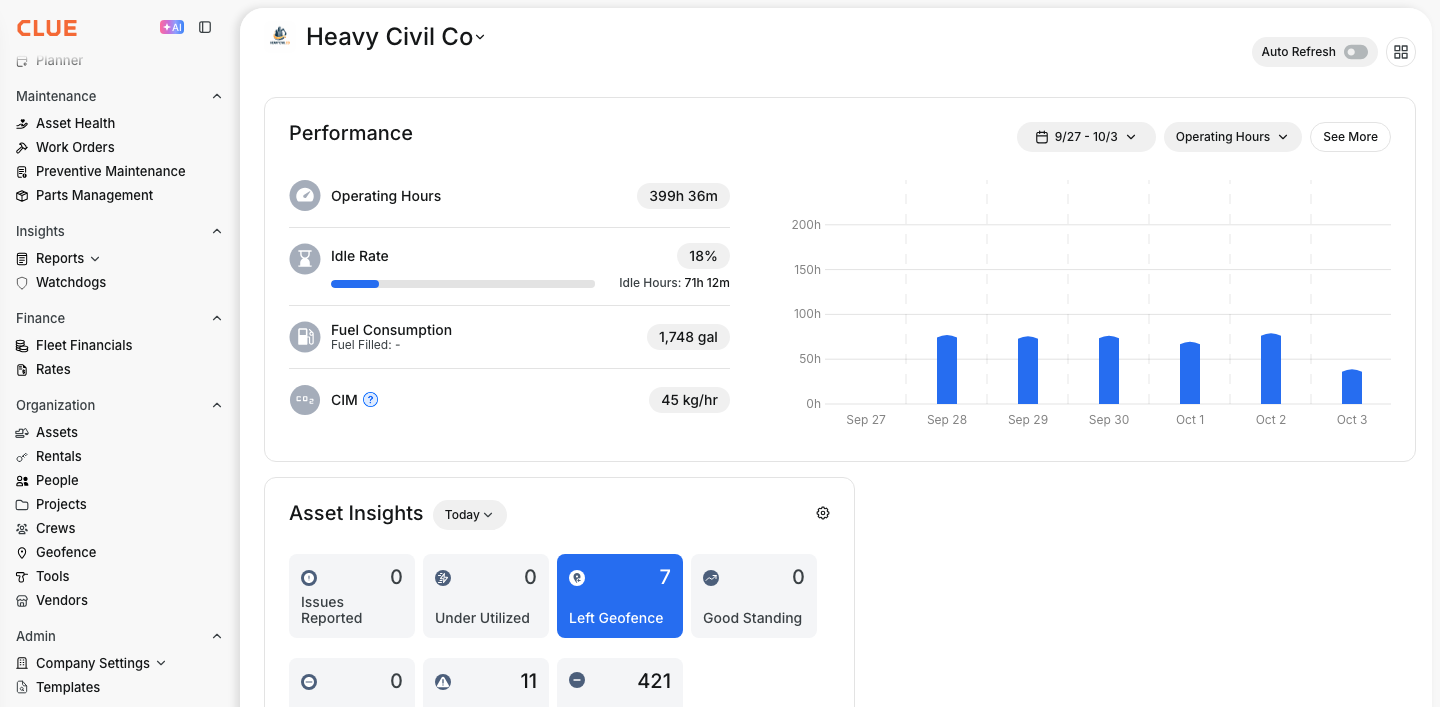
The sidebar on the left side of the page contains six main sections each which has several sub-sections:

Main Menu
- Home
- Track Everything
- Timecards
Resource Planner
- Requests
- Dispatch
- Planner
Insighs
- Reports*
- Project Productivity
- Fleet Financials
Maintenance
- Asset Health
- Work Orders
- Preventative Maintenance
- Parts Management
Admin
- Directories*
- Company Settings
Items above marked with an asterisk (*) also have items underneath them, but for the sake of saving space we left them out in the above list. You can click on each of the items in the sidebar which will take you to the related page.
Organization Switcher
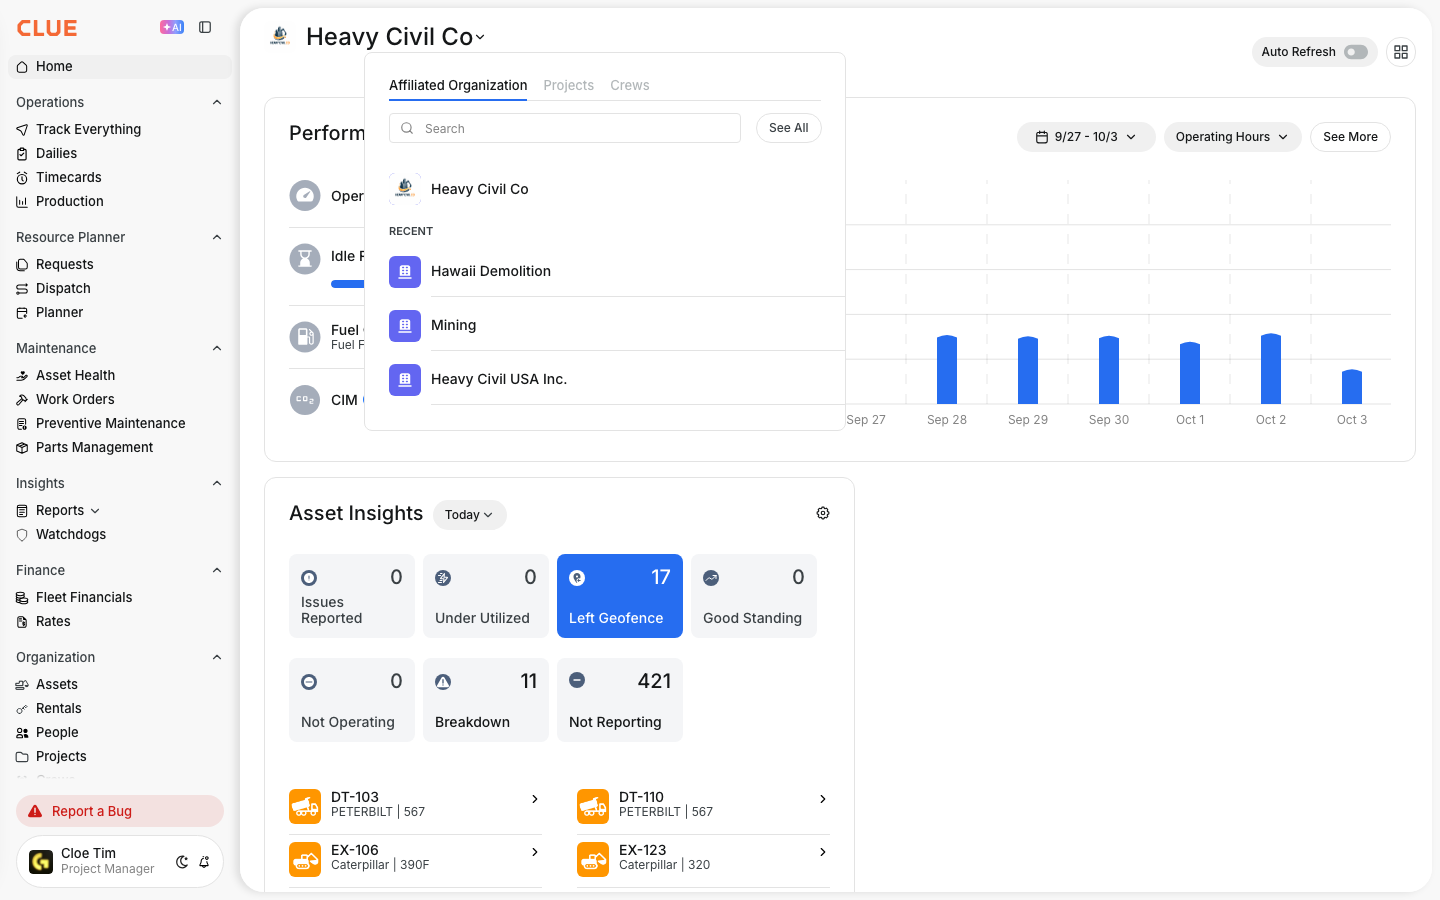
If you have access to multiple organizations, click the organization name at the top to switch between them.
Profile & Settings
At the bottom of the sidebar you will see your name, role and a cog icon. You will also see a bell icon which we'll talk about in a moment. Clicking on your name or the cog icon will bring up your profile settings. From here you can:
- Change the language in which you view the CLUE dashboard in.
- Set the date and time format.
- Manage your notifications settings.
- Read about recent updates to CLUE, our Terms of Use and Privacy Policy.
- Log Out
You can navigate back to the main dashboard by clicking on the Back to Menu link located at the top of left sidebar.

Notifications
As noted in the above section, at the bottom of the sidebar on the left side you'll see your name, role, and a bell and cog icon. Clicking on the bell icon will show you all of the notifications you have received. You can use the date range selector to only show notifications from a specific range of time. Clicking on the Unread button will display only notifications which haven't been marked as read. Selecting the Module button will allow you to filter notifications by module so you can quickly view the notifications you're most interested in. At the top of the Notifications slide-out you can mark all notifications as read, or use the Edit link to select notifications individually and then mark those as read.
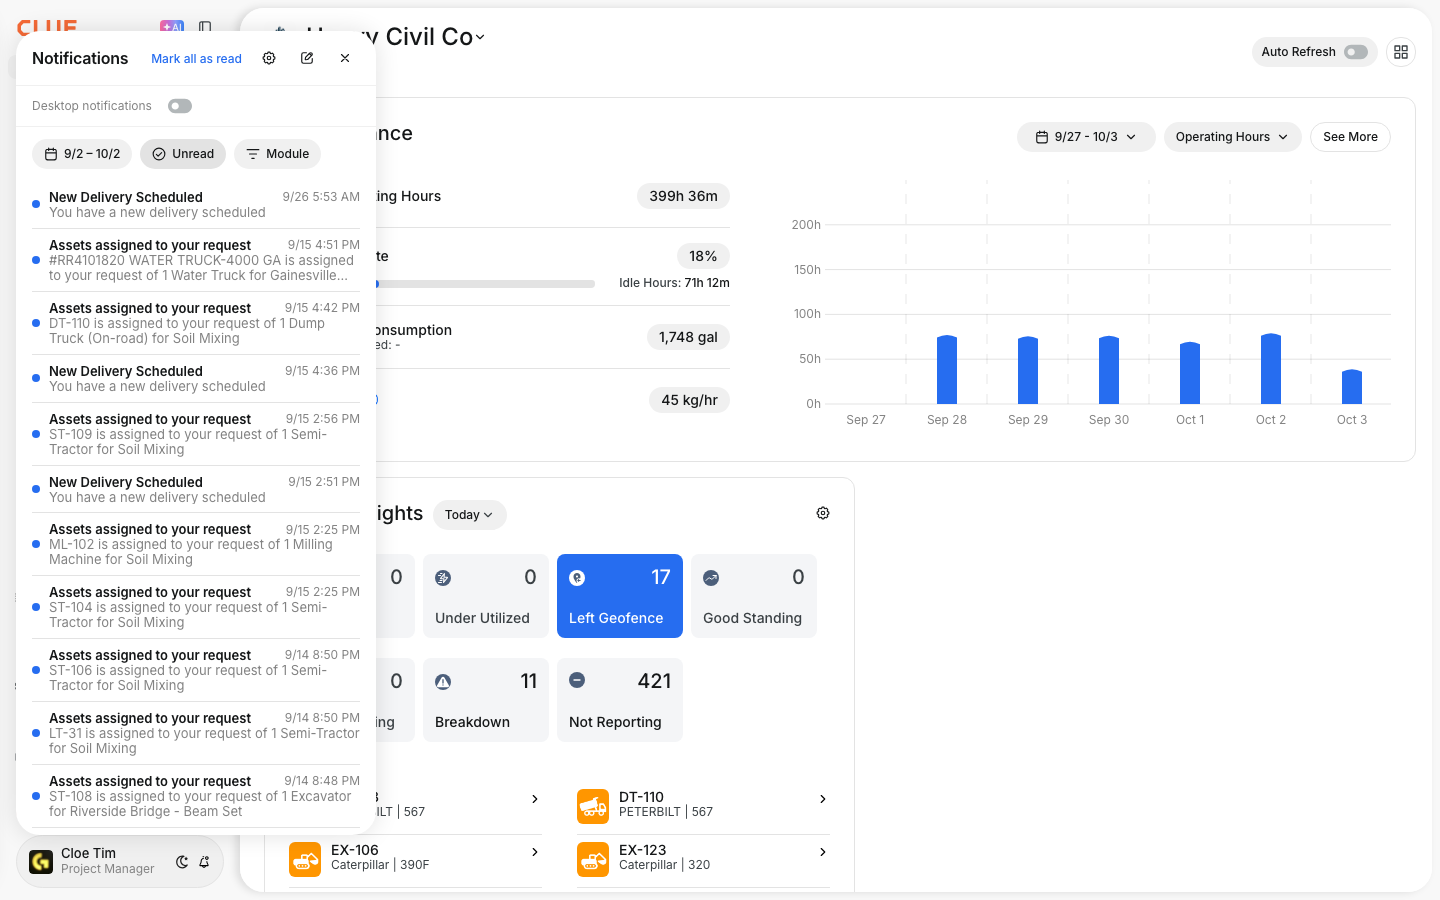
Clicking on the cog icon in the upper right corner of the Notifications slide-out will take you to your Notifications settings page. This allows you to choose which notifications you want, and how you want them delivered.
Navigation Tips
- Click any menu item to navigate to that section.
- The current section you're viewing will be highlighted in the sidebar.
- Use breadcrumbs at the top of pages to go back a section.