How to Reduce Construction Fleet Fuel Costs: The Complete Guide


Hi, I’m Maham Ali. I write about construction equipment management, helping teams use fleet data and maintenance intelligence to improve uptime, control costs, and run smoother jobsites.
Construction fleet management fuel costs are no longer a predictable line item. Diesel prices have climbed past $5.60 per gallon nationally, according to the U.S. Energy Information Administration, and for most contractors running heavy equipment fleets, fuel now represents more than 35%of total equipment operating costs. Yet most of that spend is reviewed after the fact, not managed while work is still happening.
The problem is not the price at the pump. It is the fragmented picture of what those gallons actually did. Invoices show totals. Fuel cards show purchases. Telematics shows idle time. Operations says the equipment was needed. Nobody is technically wrong. That is exactly the problem.
Reducing construction fleet management fuel costs is not a purchasing question. It is an operating discipline. Field behavior, equipment condition, dispatch timing, asset utilization, jobsite sequencing, and maintenance planning decide whether each gallon turns into production or disappears into standby time. Teams that rely on construction fuel management software to connect those dots stop reviewing waste after the month closes and start catching it while the work is still active.
That is why contractors have been able to connect asset tracking, telematics, inspections, maintenance, dispatch, and utilization data inside a single platform, so every fuel spike can be traced back to the field activity that caused it. The value is not a better dashboard. The value is knowing which gallons supported production and which gallons paid for waiting.
What Drives Construction Fleet Management Fuel Costs?

Fuel spend in construction is the total cost associated with fueling and operating equipment, vehicles, and generators across jobsites. It includes the direct cost of fuel purchases, as well as the operational factors that drive fuel consumption, such as equipment utilization, idling, haul distances, operator behavior, and fleet mix.
For most contractors, fuel spend is one of the largest variable operating expenses and a major contributor to equipment ownership and operating costs. Understanding fuel spend requires more than tracking gallons purchased; it requires connecting fuel consumption to the assets, projects, and activities that generate those costs.
What Actually Drives Construction Fleet Fuel Costs?
Fuel spend is often reported as one number, but it is built from several different cost layers.
According to the U.S. Energy Information Administration, diesel fuel now exceeds $5.60 per gallon in many regions. Research from the association of equipment manufacturers shows that 10 to 30 percent of construction equipment fuel consumption is tied directly to nonproductive idling. And the American Transportation Research Institute reports the average marginal fuel cost per mile for commercial fleets reached $0.481 in 2024. Together, those three numbers explain why construction fleet management fuel costs have moved from a line item to a margin problem.
1. Market Price
This is the most visible layer: what diesel costs per gallon. It changes with crude markets, refining capacity, regional supply, taxes, seasonal demand, and transportation constraints.
Construction companies can negotiate vendor terms, use bulk purchasing, monitor regional pricing, and apply fuel surcharge policies where contracts allow. Still, market price is only partly controllable. A fuel strategy built only around price is fragile because it depends on conditions the fleet does not own.
2. Gallons Consumed
This is the operating layer. It shows how much fuel was used across equipment, support assets, jobsites, and crews.
High fuel consumption is not automatically bad. A high-production earthmoving job will burn fuel. The real question is whether consumption matches the work performed. A loader that burns more fuel because it is feeding a well-coordinated haul cycle may be doing exactly what it should. A similar loader burning the same fuel while waiting, repositioning, or rehandling material is leaking margin.
3. Non-Productive Runtime
This is where many fleets lose control. Fuel gets burned while equipment is powered on but not producing meaningful work.
Common examples include:
- Excavators waiting for haul units.
- Loaders sitting during material delivery delays.
- Dozers running while supervisors resolve layout questions.
- Compaction equipment waiting on moisture correction.
- Assets idling during staging, inspections, or crew handoffs.
- Support equipment traveling repeatedly because work zones were poorly planned.
This cost layer is usually more controllable than fuel price. It is also harder to see unless fuel data is connected to utilization, location, and jobsite activity.
4. Fuel Leakage
Fuel leakage does not always mean theft. Sometimes it is simply weak process design.
Leakage can include:
- Fuel-card purchases assigned to the wrong asset.
- Fuel bought outside approved locations.
- Bulk fuel dispensed without hour-meter capture.
- Mobile fueling tickets not matched to equipment records.
- Duplicate or unverified transactions.
- Fuel assigned to the wrong job or phase.
- Rental equipment fueled without clean cost separation.
The direct fuel loss matters, but the bigger issue is data trust. Once teams stop trusting the fuel data, every cost discussion becomes a debate.
5. Cost Allocation Errors
Fuel cost reduction is not only about lowering total spend. It is also about charging fuel correctly.
If fuel is assigned to the wrong project, crew, asset, or cost code, job profitability becomes distorted. One job looks cleaner than it really is. Another appears worse than reality. Estimators use bad history. Project managers miss early margin warnings. Fleet leaders approve purchases or rentals based on incomplete cost signals.
Fuel belongs inside job costing, not just fleet expense reporting.
Why Fuel Cost Control is Harder in Construction

Fuel control is harder in construction than in many other fleet environments because the work is mobile, uneven, and constantly changing.
A delivery fleet usually has routes. A construction fleet has jobsites, haul roads, staging zones, equipment moves, rentals, standby periods, weather delays, crew sequencing issues, and mixed asset types. The same excavator may be highly productive on Monday, underused on Tuesday, relocated on Wednesday, and delayed by a missing attachment on Thursday.
That variability makes fuel harder to interpret.
Construction Fuel Data is Usually Fragmented
A typical construction operation may have fuel information spread across:
- Fuel-card portals
- Bulk tank systems
- Mobile fueling invoices
- OEM telematics platforms
- GPS tracking tools
- Maintenance software
- Inspection forms
- Dispatch boards
- Accounting systems
- Operator logs
- Spreadsheets
Each system may be accurate in isolation, but none of them tells the complete fuel story.
A fuel-card report can show that 80 gallons were purchased. It may not prove whether the equipment needed that fuel, whether the tank capacity made sense, whether the asset was assigned to that jobsite, or whether the fuel supported productive work.
Telematics can show runtime and idle time. It may not explain whether the equipment was waiting because the haul cycle was broken.
Maintenance records can show that service was completed. They may not reveal how a dirty filter, tire issue, hydraulic inefficiency, or delayed preventive maintenance increased fuel burn for two weeks before anyone noticed.
The problem is not lack of data. The problem is disconnected context.
Gallons Per Productive Hour
Most teams start with total gallons. Better teams track gallons by asset. Stronger teams track gallons per productive hour.
That difference matters.
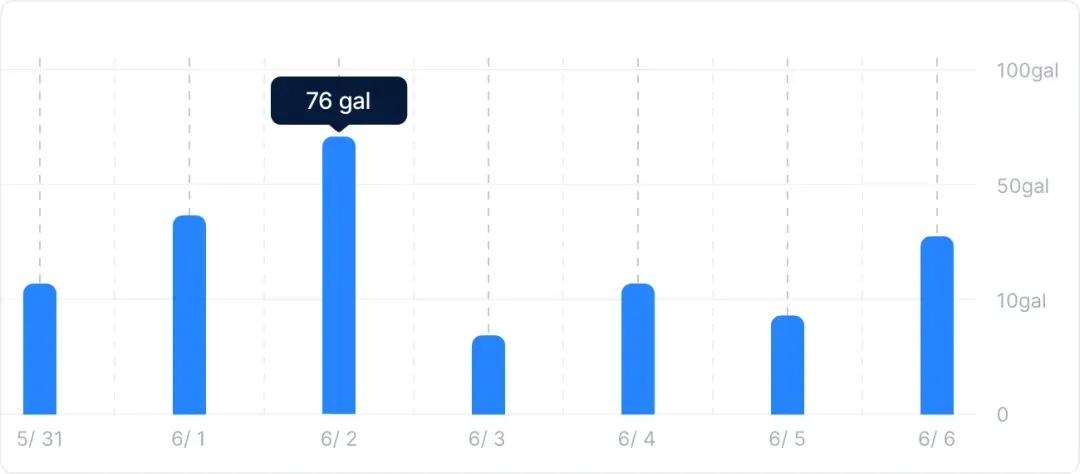
An excavator that burns 70 gallons in a day may be efficient if it produced a full shift of trenching under difficult ground conditions. The same 70 gallons may be wasteful if three hours were spent waiting on trucks, repositioning, or correcting work.
Gallons alone punish busy assets and hide underperforming ones.
What Counts as a Productive Hour?
A productive hour is not the same as an engine hour. An engine hour only proves the asset was running. A productive hour should reflect time spent doing useful work tied to the project plan.
For example:
- Excavating planned material.
- Loading haul units in an active cycle.
- Grading to required specification.
- Compacting within approved lift requirements.
- Moving material as part of scheduled production.
- Supporting an active crew without extended standby.
A productive-hour view gives fleet and operations teams a better question to ask: how much fuel did this asset burn to produce useful progress?
Use a Fuel Efficiency Stack
Instead of treating all fuel as one pool, separate it into operational layers.
- Fuel Purchased: The total gallons bought through cards, tanks, vendors, and mobile fueling services.
- Fuel Assigned: Gallons tied to a specific asset, project, operator, crew, or cost code.
- Fuel Burned: Fuel consumed based on telematics, engine data, fueling records, or calculated burn rates.
- Fuel Productive: Fuel consumed while equipment was performing useful work.
- Fuel Wasted: Tied to idling, standby, unnecessary travel, rework, poor asset matching, preventable maintenance issues, or avoidable repositioning.
This does not need to be perfect on day one. The goal is to stop pretending every gallon has equal value. It does not.
Why Fuel Waste is Usually a Planning Problem
Fuel waste starts in the plan for the day.
A crew arrives. Equipment is already running. A loader waits for trucks. A truck waits for loading. A foreman changes the sequence. An asset gets moved twice. A small maintenance issue gets pushed because the team is behind. Fuel keeps burning through every delay.
That is why fuel control belongs in operations meetings, not only finance reviews.
Idle Time Has Different Causes
Construction has its own version of that problem. Equipment may not be parked in the traditional sense. It may be waiting, staging, queuing, warming, repositioning, or moving inefficiently. The asset looks active. The production record says otherwise.
A useful fuel program separates idle time into categories.
1. Operational Idle
This happens when the equipment is ready, but the jobsite is not.
Examples include:
- Excavator waiting for haul units.
- Loader waiting for material delivery.
- Crane waiting for rigging crews.
- Dozer waiting for grade confirmation.
- Compaction equipment waiting on moisture adjustment.
The fix is usually coordination, not operator coaching.
2. Behavioral Idle
This happens when operators leave equipment running out of habit, convenience, comfort, or uncertainty. This is where policy, alerts, supervisor follow-up, and training can work.
3. Mechanical Idle
Some assets idle because teams believe shutdowns are harmful, warm-up practices are unclear, or auxiliary power needs are not handled properly. This requires guidance from maintenance leaders, not a blanket rule.
4. Administrative Idle
This happens during inspections, approvals, safety pauses, site access delays, delivery windows, or fueling waits. It is often accepted as normal because the asset is on site, but it still burns fuel.
A mature fuel program does not stop at “reduce idling.” It asks which type of idle is happening, why it exists, and who can remove it.
The Five Operating Patterns That Raise Fuel Cost
Once the cost layers are visible, the next step is finding which field behaviors create the waste. Most construction fuel problems come from five repeatable patterns.
1. Poor Asset Matching
Oversized equipment burns more fuel than needed for lighter work. Undersized equipment may run longer, harder, and less efficiently. Either way, the wrong asset increases fuel cost per unit of work.
The right question is not only, “Is this equipment available?” It is, “Is this the lowest-cost asset that can do the work safely and efficiently?”
2. Broken Dispatch Timing
Dispatch friction creates waiting, travel, and duplicated movement. If haul units arrive too late, excavators idle. If trucks arrive too early, trucks queue. If support assets are shared without a clear plan, crews lose productive time.
Fuel waste from dispatch problems often looks like operator behavior until the movement pattern is reviewed.
3. Maintenance Drag
Poor maintenance increases fuel burn before a failure occurs. Dirty air filters, worn components, low tire pressure, hydraulic issues, engine faults, and delayed service all force equipment to work harder.
This is one of the most overlooked fuel drains because the asset may still appear operational.
4. Rework
Rework burns fuel twice for one result. Overexcavation, grading corrections, failed compaction, repeated material handling, and missed layout details all increase fuel per completed unit.
Rework should be treated as a fuel problem, not only a quality problem.
5. Unnecessary Movement
Fuel gets wasted when assets travel across the jobsite too often, move between projects without proper sequencing, or relocate because attachments, crews, or materials were not ready.
Movement is not automatically productive. A busy asset can still be burning fuel in the wrong place.
Build a Jobsite Fuel Map Before Cutting Costs
Most fuel-saving advice jumps straight into tactics: reduce idle time, train operators, maintain equipment, use fuel cards, optimize routes. Those tactics are valid, but they work better after the operation knows where fuel is actually going.
A jobsite fuel map connects fuel spend to physical movement, work zones, staging areas, and production flow.
What a Jobsite Fuel Map Should Show
At minimum, the map should identify:
- Which assets consume the most fuel by jobsite.
- Which assets have the highest idle-to-runtime ratio.
- Which work zones create repeated queuing.
- Which crews depend on the same support equipment.
- Where fueling delays happen.
- Which equipment travels most often between work zones.
- Which assignments create unnecessary repositioning.
- Which assets burn fuel while waiting on another crew, trade, inspection, or delivery.
This changes the conversation. Instead of saying, “Operators need to idle less,” the team can say, “The loader near Zone C loses 80 minutes per shift because truck timing is inconsistent.”
That is not to blame. That is a fixable operating problem.
Why Fuel Cards Alone Do Not Control Fuel Costs
Fuel cards are useful. They create purchase controls, transaction records, spending limits, product restrictions, location rules, and exception reports. They are not a complete fuel management system.
A fuel card can tell you that 65 gallons were purchased at 6:42 a.m. It may also show merchant, driver, location, fuel type, and price. That helps.
But it does not answer the construction questions that matter most:
- Was the purchase tied to the correct asset?
- Did the gallons match the asset’s expected tank capacity?
- Was the equipment assigned to the project being charged?
- Did runtime justify the purchase?
- Was the asset near the active jobsite?
- Was fuel dispensed into the right unit?
- Was the fuel burned productively or lost to standby time?
Fuel-card controls reduce purchase abuse. Operational fuel controls reduce unnecessary consumption. A strong program needs both.
Fuel-Card Rules That Actually Help Construction Teams

Basic dollar limits are not enough. Construction teams need rules tied to field reality.
Set Asset-Level Fuel Expectations
Build expected gallon ranges by equipment class, tank size, shift type, utilization level, and typical burn rate. A one-size limit will miss the assets that need closer review.
Flag Location Mismatches
A fuel purchase made far from the assigned jobsite should be reviewed, especially if GPS data does not show the asset moving through that area.
Match Fuel to Engine Hours
If fuel volume rises while engine hours stay flat, the transaction deserves attention. If engine hours rise while production does not, the issue may be idle time, rework, or dispatch delay.
Separate On-Road and Off-Road Fuel
Dyed diesel, on-road diesel, yard fueling, mobile fueling, and rental fueling should be separated cleanly. Otherwise tax reporting, job costing, and project-level fuel analysis get messy.
Review Exceptions Weekly
Monthly review is too slow. By the time finance sees the issue, the behavior may have repeated across multiple jobs.
Start With a Fuel Cost Baseline
Before changing policies, build a baseline that separates normal consumption from controllable waste.
The baseline should run for at least 30 to 60 days. That gives enough time to capture different crews, projects, work conditions, asset types, and fueling patterns.
1. Baseline Metrics to Capture
Start with practical metrics, not a giant spreadsheet nobody will maintain.
Track:
- Total fuel spent by project.
- Total gallons by asset.
- Fuel cost per engine hour.
- Fuel cost per productive hour.
- Idle percentage by asset and jobsite.
- Fuel purchases outside assigned jobsite radius.
- Fuel variance by equipment class.
- Fuel assigned to rentals versus owned equipment.
- Maintenance status of high-burn assets.
- Fuel cost by operator or crew, where appropriate.
- Fuel cost per completed unit of work, when production data is available.
Do not overcomplicate the first pass. The purpose is to find the ugly patterns fast.
2. What the Baseline Usually Reveals
A good baseline typically shows three things.
A Small Group of Assets Drives a Large Share of Waste
Fuel waste is rarely spread evenly. A handful of assets, jobsites, operators, or work patterns usually create most of the problem.
Some Fuel Problems Are Planning Problems
Idle spikes often trace back to crew timing, haul coordination, missing materials, delayed inspections, or poor staging.
Maintenance Explains More Than Expected
Assets with overdue service, repeated faults, or poor inspection history often show higher fuel cost before they officially break down.
Once those patterns are visible, fuel reduction stops being a generic “save fuel” campaign. It becomes targeted operational control.
How to Reduce Construction Fleet Management Fuel Costs Step by Step

Once the baseline is clear, do not send a company-wide memo telling everyone to “use less fuel.” That kind of message sounds responsible, but it rarely changes field behavior.
The goal is not to chase every gallon. The goal is to find repeatable waste and remove it before it becomes normal.
1. Turn Idle Data into an Ownership System
Idle reports are easy to generate. Idle reduction is harder because someone has to explain why the engine was running without useful output.
A useful idle report should show more than asset name, hours, and percentage. It should show the context: location, time window, assigned crew, production status, operator, and whether the equipment was waiting on another part of the job.
Set Idle Thresholds by Asset Type
One idle rule across every asset creates bad data. A pickup, loader, excavator, crane, generator, compressor, and service truck do not operate the same way.
Set rules by equipment class:
- Short idle thresholds for light-duty support assets.
- Medium thresholds for loaders, dozers, and excavators during active work.
- Separate logic for equipment with warm-up, cool-down, hydraulic, or auxiliary power needs.
- Exemptions for safety, emergency response, inspections, or special operating conditions.
The point is not to punish every idle event. The point is to identify standby runtime with no field justification.
Separate Necessary Idle From Waste Idle
Some idle time is legitimate. Cold starts, safety checks, queue timing, and certain site requirements may justify limited engine-on time.
Waste idle usually has a pattern:
- Same asset, repeated daily.
- Same project site, same time window.
- High idle during low production.
- Idle spikes during crew handoffs.
- Long engine-on time with little movement.
- Repeated idle during fueling, staging, or waiting for instructions.
Once the pattern is visible, the conversation changes. Instead of saying, “Stop idling,” the team can ask, “Why is this loader waiting from 7:10 to 8:05 every morning?”
That is a better question.
Review Idle Exceptions Weekly
Daily alerts are useful for major outliers. Weekly review is better for fixing habits and workflow problems.
A weekly idle review should answer:
- Which assets created the most avoidable idle?
- Which jobsites had repeated standby runtime?
- Which idle events were caused by planning, not behavior?
- Which supervisors need better visibility?
- Which assets need maintenance inspection?
- Which patterns repeated from the prior week?
The best teams do not use idle reports as a blame list. They use them as a work-planning tool.
2. Connect Fuel Burn to Equipment Health
Poor service discipline does not always create immediate downtime. Sometimes it quietly raises fuel burn for weeks.
That is what makes it expensive. The equipment still runs. The crew still uses it. The project may not stop. But fuel cost rises because the asset has to work harder than it should.
Service Issues That Increase Fuel Consumption
Fuel burn can climb when teams ignore:
- Dirty air filters.
- Fuel system restrictions.
- Low tire pressure on wheeled assets.
- Worn undercarriage components on tracked equipment.
- Hydraulic inefficiency.
- Dragging brakes.
- Cooling system problems.
- Old fault codes.
- Poor lubrication.
- Delayed preventive maintenance.
Not every issue creates a loud failure. Some show up first as higher fuel per hour.
Compare Fuel Burn Before and After Service
After preventive maintenance or repair work, compare fuel performance before and after the work order. Do not close the job and move on.
Track:
- Fuel cost per engine hour before service.
- Fuel cost per useful operating hour before service.
- Idle percentage before service.
- Fault-code history before service.
- Fuel cost per engine hour after service.
- Fuel cost per useful operating hour after service.
If fuel efficiency improves after service, maintenance has a stronger business case. It is no longer only preventing downtime. It is reducing operating cost.
Treat Inspections as Fuel-Control Signals
Daily inspections are often treated as compliance paperwork. That view is too narrow.
Inspection findings can catch fuel-related problems early:
- Visible leaks.
- Low tire pressure.
- Damaged hoses.
- Excessive smoke.
- Engine warning lights.
- Hydraulic performance issues.
- Unusual vibration.
- Overheating.
- Fuel cap or tank damage.
Inspection issues should feed directly into work orders. If they stay buried in forms, the fuel waste continues quietly.
3. Improve Dispatch and Asset Allocation
Fuel gets wasted when equipment is assigned based on availability instead of fit.
This happens all the time. The nearest unit gets used. The familiar unit gets assigned again. A larger asset handles light work because nobody wants to move the right one. A rented unit stays on site because the return process is slow.
Each decision may seem harmless. Together, they raise the cost per unit of work. Support assets often create hidden fuel problems because they serve multiple crews and locations.
Examples include:
- Fuel trucks.
- Service trucks.
- Water trucks.
- Light towers.
- Compressors.
- Generators.
- Skid steers.
- Shared loaders.
These units need tighter assignment rules because shared ownership usually means weak accountability. When everyone uses an asset, nobody watches its fuel closely enough.
4. Tighten Jobsite Fueling Controls
On-site fueling can save time, but only when records are clean. Without control, bulk tanks, mobile fueling, yard fueling, and emergency refueling become easy places for cost to drift.
Reconcile Fuel Delivered, Dispensed, and Assigned
A strong fueling process compares three numbers:
- Fuel delivered to the tank, yard, or site.
- Fuel dispensed into equipment.
- Fuel assigned to projects, assets, or cost codes.
If those numbers do not line up, the team needs to know why.
Common causes include:
- Manual entry errors.
- Fuel assigned to the wrong unit.
- Missing asset IDs.
- Unrecorded emergency fueling.
- Fuel used by subcontractors.
- Spillage or meter issues.
- Unauthorized access.
- Mobile fueling invoices without asset-level detail.
Do not wait until month-end. Fuel variances get harder to explain with time.
Require Asset-Level Fuel Records
Every fueling event should capture:
- Asset ID.
- Authorized user.
- Date and time.
- Project site.
- Fuel type.
- Gallons dispensed.
- Hour-meter or odometer reading.
- Cost code.
- Fuel source, such as card, tank, yard, or mobile vendor.
If the process cannot tie fuel to an asset, it is too weak for serious cost control.
Secure Bulk Fuel Access
Bulk tanks need more than a lock. Use access controls, meter calibration, delivery logs, user-level authorization, and camera coverage where appropriate.
The goal is not to turn the site into a bank vault. The goal is to make every gallon traceable.
5. Track Fuel KPIs That Lead to Action
Fuel reports fail when they track what is easy instead of what changes decisions.
Total fuel spend is easy. It is also incomplete.
Fuel Cost Per Useful Operating Hour
This connects fuel spend to work-producing time. It helps separate hard-working assets from expensive standby assets.
Fuel Cost Per Engine Hour
This is easier to calculate than useful operating hour cost. It helps spot changes in burn patterns, but it can hide idle-heavy behavior.
Idle Gallons
Idle hours are useful. Idle gallons are better because they translate behavior into cost.
The U.S. Department of Energy’s Alternative Fuels Data Center states that idling wastes fuel and increases engine wear, and that U.S. light, medium, and heavy-duty vehicles consume more than 6 billion gallons of fuel each year without moving.
Fuel Variance by Equipment Class
Compare similar assets under similar work conditions. One loader burning far more than comparable units deserves review.
Fuel Cost by Project Site
This helps identify whether diesel waste is tied to specific layouts, supervisors, work types, staging plans, or production patterns.
Fuel Exception Rate
Track the percentage of fueling events that trigger review.
Examples include:
- Purchase outside the approved area.
- Fuel volume above expected capacity.
- Missing asset ID.
- Missing hour-meter reading.
- Purchase outside work schedule.
- Fuel type mismatch.
- Repeated manual override.
Maintenance Compliance Versus Fuel Burn
Compare preventive maintenance compliance with fuel trends. If overdue assets also show rising fuel cost per hour, the maintenance case becomes obvious.
Rental Fuel Cost
Rental equipment needs its own fuel view. Otherwise teams underestimate the full cost of keeping temporary units on site.
Common Fuel Management Mistakes

Most construction companies do not fail because they ignore fuel. They fail because they manage it too narrowly.
1. Treating Fuel as a Finance Problem
Finance sees the cost after it happens. Operations creates the cost while work is happening.
Fuel reports should be reviewed by fleet, operations, maintenance, and project leaders together. Otherwise, the team only explains last month instead of improving next week.
2. Blaming Operators First
Operator behavior matters, but it is not always the root cause.
An operator may idle because haul units are late, instructions are unclear, the work zone is blocked, or the next crew is not ready. If the organization blames the operator without checking the field context, the real problem survives.
3. Using Fleet Averages
Averages make problems look smaller than they are.
A 22 percent average idle rate may look acceptable until one project is at 41 percent and another is at 9 percent. The average hides the jobsite that needs action.
4. Ignoring Rented Equipment
Rentals are temporary, so they often escape normal controls. That is exactly why they need tighter tracking.
Fuel used by rentals should be tied to project, asset ID, rental period, utilization, and return timing. Otherwise, rental cost and fuel cost get reviewed separately even though they are operationally connected.
5. Treating Engine Hours as Productivity
Engine hours prove the asset was running. They do not prove useful work was completed.
This mistake causes teams to overestimate utilization and underestimate waste. Productive work needs context: task, movement, assignment, output, and timing.
A 30, 60, 90-Day Fuel Reduction Plan
Fuel reduction does not need to start with a massive rollout. Build control in stages.
First 30 Days
The first month is about visibility.
Focus on:
- Pulling fuel-card, bulk fuel, mobile fueling, and telematics records into one review.
- Identifying the top fuel-consuming assets.
- Identifying the highest standby-runtime assets.
- Comparing fuel cost by project site.
- Reviewing fuel exceptions.
- Checking service status on high-burn assets.
- Separating owned and rental equipment.
- Creating asset-level fuel expectations.
Do not try to fix everything. Find the repeat offenders.
Days 31 to 60
The second month is about targeted correction.
Focus on:
- Reducing repeated idle patterns.
- Correcting poor asset assignments.
- Inspecting high-burn assets for service issues.
- Tightening jobsite fueling records.
- Setting fuel-card exception rules.
- Creating weekly fuel reviews.
- Returning underused rentals faster.
- Adjusting dispatch plans where waiting time is visible.
This is where fuel savings move from theory to field execution.
Days 61 to 90
The third month is about making fuel control part of normal management.
Focus on:
- Adding fuel KPIs to fleet reviews.
- Turning inspection findings into work orders.
- Comparing project-level fuel performance.
- Reviewing cost per useful operating hour.
- Creating supervisor-level fuel scorecards.
- Updating estimating assumptions.
- Reviewing fuel trends before buying or renting more equipment.
At this point, fuel management stops being a side report. It becomes part of how the operation runs.
How Connected Fleet Data Improves Fuel Intervention

Connected fleet data is useful when it shortens the distance between a fuel problem and the decision that fixes it.
When fuel burn spikes, teams should be able to trace the cause quickly:
- Idle time.
- Service drag.
- Poor asset fit.
- Rental overuse.
- Dispatch delay.
- Incorrect cost code.
- Unnecessary movement.
- Fuel-card exception.
This is where Clue's construction fleet management software supports equipment teams. One operating layer covers asset tracking, utilization, telematics, preventative maintenance, dispatch activity, and reporting, so fuel burn is reviewed in context rather than as a standalone expense.
For fuel management, that means fuel burn can be reviewed against asset location, engine hours, idle time, jobsite assignment, service status, and work history instead of being treated as a standalone expense.
A fuel spike may come from excessive idle time, but it may also point to a poorly matched asset, a delayed dispatch move, an overdue service item, a recurring fault, a jobsite queue, or fuel being charged to the wrong project. With connected workflows, teams can move from “fuel went up” to a more useful question: which asset burned more fuel, where was it working, what was it doing, and what action should happen next?
Fuel Reduction Should Improve Estimating and Equipment Rates
Fuel data should not stay trapped in fleet reports. It should improve how future work is priced.
If a project type consistently burns more fuel because of haul distance, terrain, staging limits, support asset demand, or seasonal conditions, that history should shape the next bid.
Build Project-Type Fuel Benchmarks
Estimators should be able to compare fuel history by:
- Project type
- Equipment class
- Production quantity
- Haul pattern
- Soil or material condition
- Season
- Region
- Owned versus rented equipment
- Project phase
This turns fuel from a backward-looking expense into a planning input.
Update Internal Equipment Rates
Internal rates often rely on outdated assumptions. That creates bad project costing before work even starts.
Better fuel history helps update rates using:
- Actual burn by equipment class
- Utilization pattern
- Idle exposure
- Maintenance condition
- Project type
- Fuel price movement
- Mobilization requirements
- Rental fuel burden
This is not accounting cleanup. It is margin protection.
Fuel Savings Also Support Emissions Goals
Owners, municipalities, public agencies, and large general contractors are asking more questions about emissions and sustainable construction practices. Fuel reduction gives contractors a practical way to improve environmental performance without waiting for full fleet electrification.
The fastest opportunities are still operational:
- Less standby runtime
- Better dispatch
- Fewer unnecessary moves
- Cleaner service discipline
- Less rework
- Smarter asset matching
- Better utilization planning
The same actions that protect fuel budget also reduce emissions. Finance and sustainability rarely line up this cleanly.
Fuel Reduction Audit Checklist
Use this checklist to pressure-test the fuel program.
Data Visibility
- Are all fuel sources tracked?
- Is every fueling event tied to an asset?
- Are gallons tied to projects and cost codes?
- Can fuel purchases be compared against engine hours and utilization?
- Are rentals separated from owned equipment?
Field Operations
- Are idle patterns reviewed weekly?
- Are assignments based on work fit, not just availability?
- Are shared support assets tracked closely?
- Are unnecessary moves reviewed?
- Are fueling delays visible?
Equipment Health
- Are high-burn assets inspected for service issues?
- Are inspection findings converted into work orders?
- Is fuel burn compared before and after maintenance?
- Are fault codes reviewed before downtime?
- Are tires, filters, hydraulics, and undercarriage condition treated as fuel-cost factors?
Cost Control
- Are fuel-card exceptions reviewed weekly?
- Are bulk fuel variances reconciled?
- Are project-level fuel costs reviewed during active work?
- Are fuel assumptions updated in estimates?
- Are internal rates based on current burn history?
Conclusion
Reducing construction fleet fuel costs is not one tactic. It is not only cheaper diesel, fuel cards, idle reduction, maintenance, or telematics.
It is the discipline of connecting fuel to the work that caused it.
Strong fleets do not only ask how much fuel they bought. They ask which assets burned it, where it happened, whether the work justified it, what delay created the waste, and how that pattern can be removed before it repeats.
That is the shift. Every gallon has a story. The goal is to make sure that story ends in production, not waiting.
Clue gives construction teams a clearer view of fuel usage alongside asset activity, utilization, maintenance status, and jobsite movement. That makes fuel easier to investigate while work is still active, not weeks later in a cost report. The right fuel management software does not just track gallons. It connects every gallon to the decision that caused it.
FAQs
What is the best way to reduce construction fleet fuel costs?
Start with non-productive fuel burn. Review idle patterns, dispatch delays, poor asset matching, maintenance issues, fuel-card exceptions, and jobsite fueling controls. Cheaper diesel helps, but wasted gallons are usually more controllable.
How can construction fleets reduce idle fuel waste?
Separate idle time by cause. Operational idle needs better planning. Behavioral idle needs coaching and alerts. Mechanical idle needs service guidance. Administrative idle needs better workflow control.
Are fuel cards enough to control construction fuel costs?
No. Fuel cards control purchases. They do not prove whether fuel was used productively. Construction teams also need asset-level tracking, utilization data, maintenance history, and jobsite context.
What fuel KPIs should construction fleet managers track?
Track fuel cost per useful operating hour, fuel cost per engine hour, idle gallons, fuel variance by equipment class, fuel cost by project site, exception rate, rental fuel cost, and maintenance compliance versus fuel burn.
How does maintenance affect fuel consumption?
Poor service conditions can raise fuel burn before an asset fails. Dirty filters, tire issues, worn components, hydraulic problems, unresolved fault codes, and overdue PM can all increase operating fuel expense.
How often should construction teams review fuel reports?
Review exceptions and idle patterns weekly. Monthly review is useful for accounting, but it is usually too slow for active jobsite correction.
Does reducing diesel use help with emissions reporting?
Yes. EIA lists diesel at 22.45 pounds of CO2 per gallon. Reducing unnecessary diesel use lowers both operating cost and emissions output.
What is construction fleet management software?
Construction fleet management software is a platform that connects equipment tracking, maintenance scheduling, dispatch, utilization, and fuel data into one operating view. It gives fleet managers and project teams real-time visibility into where assets are, how they are being used, and whether fuel spend is tied to productive work or standby time.
How does fuel management software reduce construction costs?
Fuel management software reduces construction costs by connecting fuel purchases to specific assets, jobsites, and cost codes so waste is visible before it repeats. When fuel data is linked to telematics, utilization, and maintenance records, teams can identify idle patterns, poor asset assignments, service-related burn increases, and dispatch delays that would otherwise appear only as a higher monthly fuel bill.
Transform Your Equipment Management