What is Operations Maturity Model in Construction? Complete Overview


Hi, I’m Maham Ali. I write about construction equipment management, helping teams use fleet data and maintenance intelligence to improve uptime, control costs, and run smoother jobsites.
Construction firms operate in one of the most volatile, asset-intensive environments in the global economy. Margins are tight, delivery schedules are exposed to weather and supply variability, and heavy equipment often sits on the critical path of project execution. Against this backdrop, structured capability progression is no longer optional.
This guide explains what maturity means in the construction context, how to measure it, and how to elevate it using research-backed principles. It also connects this framework to related models such as the IT operations maturity model, security operations maturity model, legal operations maturity model, and revenue operations maturity model, because long-term competitiveness requires alignment across functions.
What is Operations Maturity in Construction?

Operations maturity in construction refers to the degree to which an organization's processes are clearly defined, consistently executed, and measured with reliable data. It reflects the level of capability, consistency, and control embedded in the way work is executed, spanning:
- Field execution discipline
- Fleet lifecycle governance
- Maintenance and reliability processes
- Safety compliance
- Materials logistics
- Financial feedback loops
- Workforce coordination
A structured operations maturity model defines levels of advancement that range from reactive and inconsistent to optimized and adaptive. This differs from performance metrics; while performance measures results, maturity measures the underlying system that produces those results.
Why Operation Maturity Matters in Construction?
Productivity in construction has historically lagged behind other sectors.
McKinsey estimates that global construction productivity growth has averaged around 1 percent annually over two decades, significantly below manufacturing rates, creating a trillion-dollar opportunity gap.
Heavy equipment reliability is equally consequential. McKinsey research on predictive maintenance indicates that data-driven reliability programs can reduce breakdowns by 30% to 50% and extend asset life by 20% to 40%.
When equipment fails unexpectedly, schedules slip, labor sits idle, and project costs escalate. Studies in industrial reliability show that unplanned downtime can cost thousands of dollars per hour depending on asset type.
These performance gaps are not primarily technology issues. They are capability issues. An operations maturity model assesses whether the organization has standardized workflows, clean data, accountable governance, and measurable improvement cycles that make performance predictable.
What are the Five Levels of Operational Maturity in Construction?

The five levels of operational maturity in construction range from reactive, ad hoc execution to optimized, data-driven performance. Most maturity frameworks use these staged levels to describe how an organization moves from unpredictable results to predictable delivery and continuous improvement. Construction-specific research emphasizes a defined framework with progressive criteria that helps firms evaluate current capability and chart an improvement path.
Below is the same five-level structure, expanded with jobsite reality, fleet implications, and the signals you can actually validate.
Level 1: Reactive
At this stage, outcomes depend on individual experience rather than a repeatable operating system.
What it looks like on site
- Crews rely on tribal knowledge, radio calls, and last-minute coordination.
- Daily plans change constantly because constraints are discovered late (missing equipment, missing attachment, waiting on service truck).
How assets are managed
- Breakdowns drive maintenance activity; repairs start after a failure stops production.
- Inspections are inconsistent and often paper-based, which makes them hard to audit and easy to lose.
Construction equipment management like Clue, Upkeep, Equipment360 replaces scattered checklists with standardized inspections tied directly to each asset.
What data looks like
- "Status" lives in people's heads (available, down, moved, returned) with no consistent definition.
- KPIs are mostly lagging, high-level, and backward-looking (total spend, total hours), with limited root-cause detail.
Level 2: Emerging
Basic structure exists, but compliance and trust in the system are uneven.
What it looks like on site
- Standard procedures exist, but they are applied inconsistently across crews, projects, and regions.
- Dispatch decisions still depend heavily on phone calls and informal updates.
How assets are managed
- Preventive schedules exist in spreadsheets or calendars, but work is deferred when production pressure rises.
- Failures repeat because the feedback loop between field reporting and repair resolution is weak.
What data looks like
- Telematics may be installed, but the information is not consistently translated into decisions.
- Utilization is reported, yet idle time is not actively governed with clear actions (redeploy, re-sequence work, or adjust staffing).
Clue's equipment utilization turns raw telematics into actionable visibility, so teams can redeploy assets, re-sequence work, or adjust staffing in real time.
Level 3: Standardized
Execution becomes repeatable because workflows, definitions, and measurement are consistent.
What it looks like on site
- Teams run a reliable operating cadence (daily planning, near-term lookahead, clear ownership of constraints).
- Requests, assignments, and returns follow standard workflows rather than ad hoc coordination.
How assets are managed
- Service planning uses consistent triggers such as engine hours and scheduled intervals.
- Work orders contain usable detail (symptom, context, timestamp, location, priority), enabling faster triage.
What data looks like
- Core signals are captured consistently: engine hours, downtime, utilization, inspection completion, and basic fault categories.
- A common indicator is preventive compliance staying consistently above a baseline threshold (often around the mid‑80s percent range, depending on fleet mix and seasonality).
- Reviews happen on a schedule (weekly or biweekly) with assigned owners and tracked actions.
Level 4: Managed and Optimized
The organization shifts from tracking to steering. Leaders use leading indicators, and reliability becomes engineered, not hoped for.
What it looks like on site
- Planning is resilient: schedules anticipate maintenance windows, transport time, and contingency assets.
- Jobsite execution improves because constraints are reduced before they hit the crew.
How assets are managed
- Downtime is classified with meaningful categories, and recurring causes are attacked systematically (not just repaired).
- Backlog is governed with targets (age, criticality, readiness impact), so "waiting on parts" does not silently expand.
- Maintenance decisions account for production impact, not only technical urgency.
What data looks like
- Data quality improves enough to support trend detection, early-warning signals, and priority scoring.
- Cost-per-hour and downtime drivers are visible by asset class, job type, and location, enabling targeted intervention.
Level 5: Adaptive and Innovative
The organization uses data to anticipate and reconfigure. Improvement is continuous, and the operating system adapts as conditions shift.
What it looks like on site
- Portfolio-level planning balances multiple projects with shared resources and shifting priorities.
- Scenario planning is normal: leaders test "what if" conditions (weather disruption, asset failure, schedule pull-ahead) and adjust proactively.
How assets are managed
- Lifecycle decisions are evidence-based: rebuild vs replace vs rent is supported by utilization patterns, reliability history, and financial impact.
- Field feedback loops are fast: issues are captured, triaged, resolved, and closed with learnings that prevent recurrence.
What data looks like
- Operational and financial systems are tightly linked, so project controls reflect real equipment behavior, not assumptions.
- Risk is quantified, tracked, and reduced through governance routines that connect operations, maintenance, finance, and IT.
This kind of staged progression is consistent with how maturity models are described in construction research: structured, level-based frameworks that evaluate current capability and guide improvement toward more predictable and controllable outcomes.
How Maturity Intersects With Other Operational Domains?

Construction performance depends on more than field discipline. Execution maturity is reinforced or undermined by adjacent operating systems.
IT Infrastructure
The IT operations maturity model governs system reliability, integrations, and data governance. If integrations between telematics, ERP, and project systems are unstable, utilization reports drift, preventive triggers fail, and decision quality declines. Field maturity depends on dependable digital infrastructure.
Cyber Resilience
The security operations maturity model protects connected equipment, mobile applications, and cloud platforms. A cyber disruption can stall dispatch, payroll, or billing. Operational stability requires secure, continuously available systems.
Contract and Compliance Governance
The legal operations maturity model ensures structured contract handling, documentation control, and claims management. Weak governance results in disputed standby charges, delayed approvals, and regulatory exposure. Execution discipline must be defensible on paper.
Financial Alignment
The revenue operations maturity model connects field accuracy to cost capture and billing precision. Without alignment, equipment hours, downtime, and change work fail to translate into protected margin. Operational strength must convert into financial clarity.
True maturity is systemic. When field processes, digital systems, financial controls, and compliance workflows reinforce each other, performance becomes predictable.When they operate in silos, capability plateaus.
Equipment and Maintenance as Core Capability Drivers
Maintenance maturity models often move from reactive to preventive to predictive and prescriptive approaches.
McKinsey's predictive maintenance research confirms measurable financial impact when organizations advance along this ladder.
In a construction context:
| Stage | Equipment Approach | Typical KPI Profile |
|---|---|---|
| Reactive | Breakdown-driven repairs | High unplanned downtime |
| Preventive | Calendar-based PM | Improved uptime |
| Condition-based | Sensor-informed checks | Reduced failure frequency |
| Predictive | Data-driven forecasting | Lower cost per hour |
| Prescriptive | Optimization algorithms | Strategic asset allocation |
Telematics platforms support higher maturity by centralizing utilization, engine diagnostics, and inspection compliance. Industry reporting consistently highlights telematics as a catalyst for fleet optimization.
Clue's construction equipment maintenance software operationalizes this progression.
Instead of treating telematics, inspections, and maintenance as separate systems, Clue connects them into one continuous asset record; linking utilization data, preventive schedules, inspection findings, and repair history in a single environment.
Tools and Methodologies to Measure Operational Maturity in Construction
A construction operations capability assessment is more defensible when it uses established frameworks rather than opinions. The three method families below are commonly combined because they answer different questions:
- CMMI-style frameworks: Are core practices defined, governed, and repeatable?
- Lean methods: Where is time, motion, and rework hiding inside workflows?
- Six Sigma: Where does variation create defects, delays, and reliability failures?
Used together, they help you score current capability, isolate the highest-friction workflows, and then correct the root causes that keep performance inconsistent.
Capability Maturity Model Integration
CMMI is a set of best practices designed to build and benchmark organizational capabilities. It is often used to characterize capability levels and drive prioritized improvement rather than tackling everything at once.
- A structured way to score how consistent and controlled your core operational practices are.
- A disciplined focus on a manageable number of practice areas at a time, which reduces "boil the ocean" failure modes.
- A maturity concept that separates "we do this sometimes" from "we do this reliably across projects and regions."
Lean Manufacturing
Lean is a management approach centered on delivering value with fewer resources and less waste, supported by continuous experimentation and ongoing improvement. Continuous improvement, often called Kaizen, is explicitly about making small, incremental changes to eliminate waste and improve quality and efficiency.
Lean becomes construction-relevant when you treat "operations" as a set of flows:
- Flow of equipment to the work
- Flow of parts, tools, and fuel to keep equipment productive
- Flow of information so status, requests, and approvals do not stall execution
Six Sigma
Six Sigma is a set of methods designed to improve process capability by reducing variation that leads to defects and errors. DMAIC, Define, Measure, Analyze, Improve, Control, is the common structured approach used to improve existing processes that are not meeting performance expectations.
Many construction organizations are not failing because they have no process. They are failing because execution varies wildly by:
- Region
- Project type
- Foreman approach
- Technician skill mix
- Vendor lead times
That variability makes outcomes unpredictable even when average metrics look fine.
How Clue Enables Operational Maturity Advancement in Construction?
An operations maturity model is only effective when supported by systems that enforce discipline, capture reliable data, and connect workflows across teams. In construction, that requires more than reporting dashboards. It requires a unified operating layer.
Clue supports maturity progression by strengthening the structural capabilities that underpin predictable execution.
Centralized Operational Visibility
Operational maturity depends on clean, consolidated data. Clue integrates 80+ systems including telematics, GPS, maintenance records, inspections, and utilization signals into a single platform. This eliminates fragmented reporting and creates a consistent data foundation for scoring maturity dimensions such as availability, downtime classification, and preventive compliance.
Structured Maintenance Execution
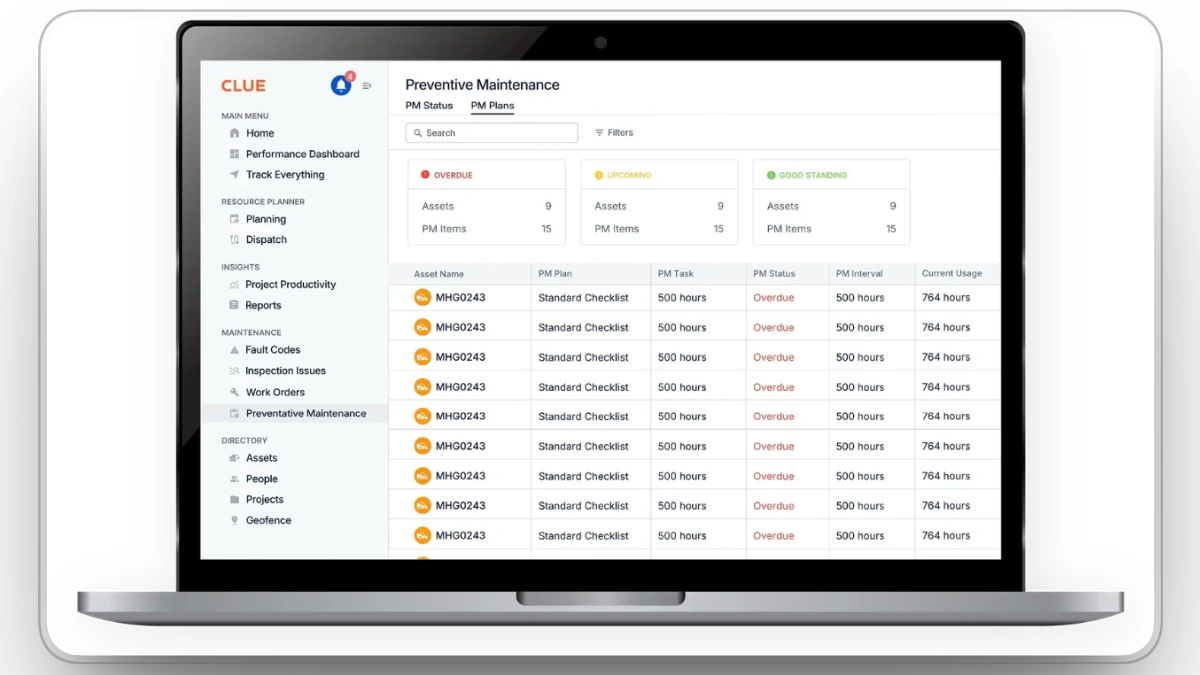
Advancing from reactive to preventive and predictive stages requires disciplined maintenance workflows. Clue automates preventive maintenance scheduling based on engine hours and service intervals, tracks work orders, and maintains asset history.
This supports higher maturity levels by:
- Reducing unplanned downtime
- Improving PM compliance
- Creating structured failure documentation
- Enabling trend analysis across asset classes
Maintenance maturity becomes measurable rather than anecdotal.
Real-Time Utilization Governance

Fleet maturity requires active management of idle time and redeployment decisions. Clue provides real-time utilization tracking, enabling teams to distinguish between productive hours, idle time, and downtime.
This allows leadership to:
- Identify underused assets
- Reduce rental leakage
- Support capital allocation decisions
These capabilities align directly with principles found in a revenue operations maturity model, where operational accuracy drives financial clarity.
Automated Workflow Integration
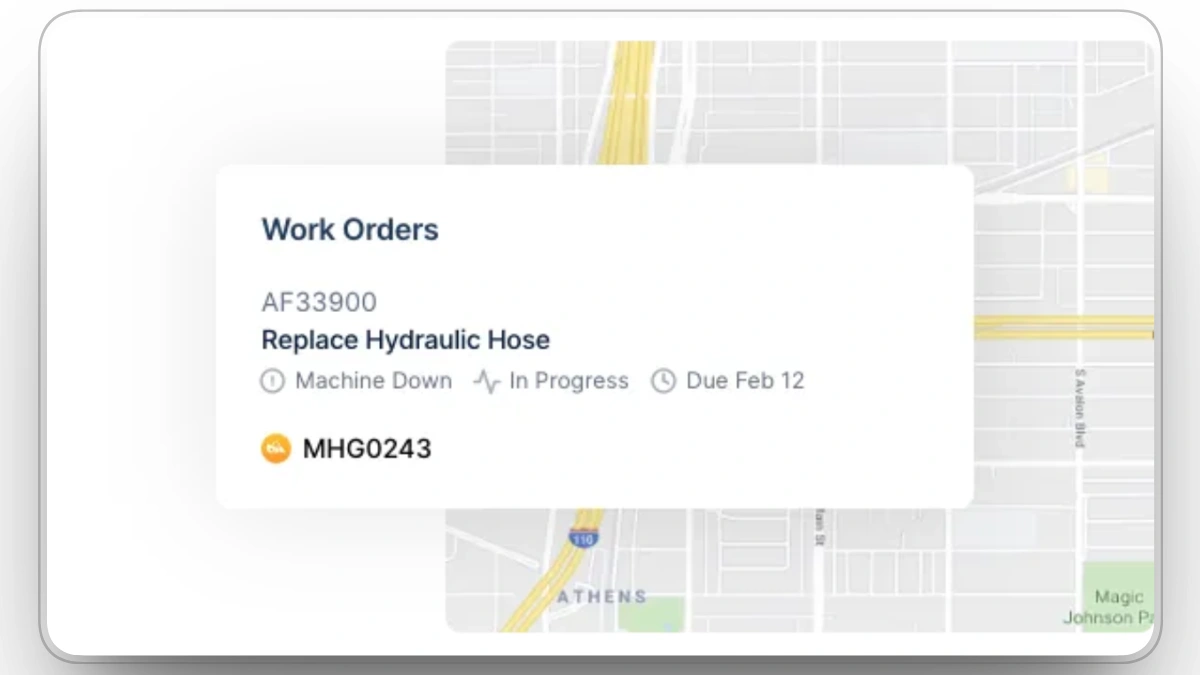
Manual reconciliation slows response time and introduces error. Clue connects inspections, alerts, and work orders so that issues captured in the field translate immediately into structured action.
Automated triggers compress latency between detection and resolution. That shift is fundamental when progressing from standardized to managed and optimized maturity stages.
Analytics That Support Continuous Improvement
Maturity progression depends on moving beyond static reporting toward actionable insight. Clue's reporting and analytics capabilities enable organizations to track downtime drivers, maintenance KPIs, and utilization patterns over time.

Measuring Maturity Through a Structured Assessment Framework

A maturity assessment should not be a perception survey. It should produce a defensible score, a quantified gap analysis, and a ranked improvement roadmap. The objective is clarity: where you are, why you are there, and what moves the needle next.
Step 1: Define Outcome Objectives
Start with business outcomes, not process improvements.
Examples:
- Reduce unplanned downtime by 20 percent
- Increase fleet utilization by 15 percent
- Improve preventive maintenance compliance to 95 percent
- Reduce repair cycle time by 25 percent
Link each objective to a measurable KPI and a financial implication. Without a defined outcome, maturity scoring becomes abstract.
Step 2: Choose the Assessment Scope
Avoid enterprise-wide evaluation at the start. Scope tightly:
- One region
- One project cluster
- One equipment class
A focused scope improves accuracy, speeds validation, and prevents analysis paralysis. Mature organizations scale assessments only after methodology is proven.
Step 3: Select the Maturity Framework
Adopt a structured progression, typically a 5-tier model. Define what qualifies for each level with evidence-based criteria.
Ensure alignment with the IT operations maturity model so data infrastructure, integrations, and reporting pipelines are reliable enough to support accurate scoring. Poor digital readiness will distort the assessment.
Step 4: Collect Evidence, Not Opinions
Use triangulated inputs:
- System exports (telematics hours, utilization, downtime logs, PM records)
- Interviews across roles (operators, foremen, dispatch, shop managers, finance)
- Field observations (actual workflow behavior versus documented procedure)
- Audit documentation (inspection samples, work order quality, backlog aging)
The goal is validation. If documentation claims discipline but observation shows inconsistency, score accordingly.
Step 5: Score Across Critical Dimensions
Evaluate capability across structured domains, such as:
- Process definition and standardization
- Data completeness and accuracy
- Governance and accountability
- Cross-functional coordination
- Technology enablement and workflow automation
Score each dimension independently. Many organizations are strong in one area and weak in another. Aggregation without dimension-level clarity hides the constraint.
Step 6: Identify Root Causes Behind Gaps
Separate symptoms from structural blockers.
For example:
- Low PM compliance may stem from scheduling pressure (governance issue), not technician capacity.
- Inconsistent downtime coding may reflect unclear definitions (data design issue), not operator negligence.
- Poor utilization visibility may be caused by integration instability (IT maturity gap), not reporting neglect.
Categorize gaps into:
- Process design weakness
- Adoption and training deficiency
- Data inconsistency
- Tool or integration limitation
- Governance conflict
This clarity determines which interventions are required.
Step 7: Prioritize Initiatives by Impact
Rank improvement initiatives using two filters:
- Financial impact
- Implementation feasibility
High-impact, low-complexity changes should move first. Examples include:
- Standardizing downtime reason taxonomy
- Automating PM triggers based on engine hours
- Establishing idle thresholds for redeployment decisions
Avoid overloading the organization with simultaneous transformation streams.
Step 8: Implement, Monitor, and Reassess
Execution discipline determines whether maturity advances.
Embed:
- Monthly KPI reviews with named owners
- Quarterly reassessment using the same scoring rubric
- Governance routines that enforce closure of corrective actions
Maturity is not a one-time project. It is an operating discipline that compounds over time.
Capability Dimensions in Detail
An operational maturity assessment is only meaningful when it evaluates the underlying capability drivers. These dimensions determine whether performance is stable, scalable, and resilient.
Data Integrity
Mature operations rely on clean, standardized, and trusted inputs.
In construction and heavy equipment environments, this includes:
- Consistent status definitions (available, assigned, down, in transit)
- Structured downtime categories
- Accurate engine hours and timestamps
- Complete inspection records with defect severity
If data definitions vary across regions or teams, forecasting fails and KPI credibility erodes. Advanced analytics cannot compensate for inconsistent inputs. Data discipline is the foundation of maturity viability.
Analytical Depth
Organizations typically evolve from reporting what happened to understanding why it happened and ultimately anticipating what will happen next.
At lower maturity levels:
- Dashboards show utilization and downtime totals.
At higher maturity levels:
- Root causes are identified.
- Trends are segmented by asset class, job type, and operating conditions.
- Leading indicators influence planning decisions before breakdowns occur.
Analytical depth transforms reporting into operational steering.
Automation
Automation removes friction from workflows that are otherwise manual and error-prone.
Examples in construction:
- Inspection findings automatically generating work orders
- Engine-hour thresholds triggering preventive tasks
- Status changes updating dashboards in real time
- Automated alerts for overdue services
When reconciliation depends on spreadsheets or manual communication, latency increases and issues compound. Automation compresses response time and reduces human error.
Workforce Adaptability
Mature organizations reduce dependency on individual expertise.
This includes:
- Cross-training technicians across equipment categories
- Clear shift handoff protocols to preserve context
- Defined escalation paths for defects
- Coverage models that absorb absenteeism or surge demand
Adaptable teams prevent small disruptions from escalating into schedule delays.
Governance and Accountability
Operational discipline requires explicit ownership.
Shared governance across field operations, maintenance, finance, and IT ensures:
- Data standards are enforced
- KPIs have accountable owners
- Conflicts between production and service windows are resolved systematically
- Financial impacts are visible and addressed
Without governance, even well-designed processes degrade over time.
Structured governance is also central to adjacent frameworks such as the security operations maturity model and the legal operations maturity model, where defined controls and accountability reduce exposure and protect continuity.
What are the Benefits of Operational Maturity in Construction?

The benefits of operational maturity in construction include higher productivity, lower equipment downtime, and stronger financial control. Industry research and field data consistently demonstrate that organizations with stronger operational systems outperform those relying on reactive execution.
1. Higher Productivity
Structured operational systems reduce workflow friction, improve coordination, and increase schedule reliability. Research shows construction productivity has historically lagged other industries, and disciplined execution frameworks are essential to closing that gap.
2. Lower Equipment Downtime
Data-driven maintenance approaches significantly reduce breakdown frequency and extend asset life. Studies on predictive maintenance show measurable reductions in failure rates and maintenance costs when structured processes and condition data are applied consistently.
3. Stronger Financial Control
Clear visibility into utilization, downtime, and cost per hour improves capital allocation and margin protection. This aligns with principles found in a revenue operations maturity model, where operational accuracy strengthens financial performance.
4. Reduced Compliance and Contract Risk
Standardized inspections and structured documentation reduce rework, disputes, and regulatory exposure. These controls reinforce the governance logic seen in a legal operations maturity model.
5. Greater Cyber and System Resilience
Connected equipment and digital workflows require strong controls to protect continuity. Alignment with a security operations maturity model ensures operational systems remain stable, secure, and continuously available.
Designing a Construction-Specific Scorecard
A robust scorecard should include:
| Scorecard Component | What It Measures | Construction-Specific Application |
|---|---|---|
| Current Level Rating | Present maturity stage across defined dimensions | Field execution discipline, equipment readiness, maintenance workflow, data integrity |
| Target Level (24 Months) | Desired maturity state within a defined timeframe | Improved PM compliance, reduced downtime, stronger utilization governance |
| Gap Summary | Capability shortfalls preventing advancement | Inconsistent downtime coding, weak integration between telematics and ERP, unclear ownership |
| Initiative Roadmap | Prioritized improvement actions with owners and timelines | Standardizing inspections, automating PM triggers, improving dispatch rules |
| KPI Baseline | Quantified starting metrics | Availability %, idle %, cost per hour, MTTR, PM compliance |
| IT Readiness Alignment | Data reliability and integration maturity | Stability of telematics feeds, ERP synchronization accuracy, reporting automation aligned with the IT operations maturity model |
| Security Governance Layer | System protection and access control discipline | User permissions, device security, audit trails aligned with the security operations maturity model |
| Financial Integration | Operational-to-financial synchronization | Equipment charge rates, billing accuracy, cost allocation consistency aligned with the revenue operations maturity model |
It should also integrate insights from the IT operations maturity model, security operations maturity model, and revenue operations maturity model to ensure enterprise coherence.
Key Challenges in Advancing Operational Maturity in Construction

Progressing along a maturity curve is not purely technical. Construction organizations face structural and behavioral barriers that can slow or stall advancement.
1. Resistance to Standardization
Field teams often rely on experience and informal coordination. Introducing structured workflows and defined governance can be perceived as unnecessary control unless clearly tied to measurable performance improvement.
2. Weak Data Foundations
Inconsistent downtime codes, misaligned status definitions, and unstable system integrations undermine scoring accuracy and predictive insight. Without clean inputs, maturity cannot progress.
3. Functional Silos
Operations, maintenance, finance, and IT frequently optimize independently. When governance is not unified, improvements in one area fail to translate into system-wide gains.
4. Production Pressure
Tight schedules often push preventive routines aside. Deferred maintenance and inconsistent review cadence quickly erode capability.
5. Tool-First Thinking
Technology amplifies discipline but does not create it. Without standardized processes and ownership, digital platforms add complexity instead of control.
6. Unclear Accountability
Maturity requires defined KPI ownership, enforced standards, and recurring review cycles. When accountability is diffuse, systems degrade.
7. Change Fatigue
Capability advancement alters daily workflows. Without leadership reinforcement and structured adoption, improvement efforts lose momentum.
90-Day Activation Plan
First 30 Days
- Baseline downtime, utilization, and PM compliance
Days 31-60
- Standardize inspection workflow
- Implement structured downtime codes
Days 61-90
- Launch quarterly review governance
- Integrate performance data with finance
Conclusion
An operations maturity model is not an academic exercise. It is a structured roadmap to predictable delivery. Construction organizations that invest in disciplined capability improvement outperform peers in reliability, cost control, and stakeholder confidence.
Technology plays a reinforcing role in this progression. Platforms such as Clue support maturity advancement by centralizing fleet data, structuring maintenance workflows, automating inspection-to-work-order processes, and providing real-time utilization visibility.
Construction will always involve uncertainty. Maturity does not remove volatility. It builds systems capable of managing it.
Frequently Asked Questions
1. Can operational maturity assessments be done without digital tools?
Yes, a maturity assessment can begin with manual audits, interviews, and field observations. However, digital tooling becomes essential as you move beyond early maturity levels because consistent data capture and workflow automation are required for reliable scoring and advanced insights.
2. How often should an organization reassess its maturity level?
Reassessment should occur on a fixed cadence, quarterly for fast-moving projects or semi-annually for enterprise initiatives to track progress, adjust targets, and validate that improvements are translating into measurable operational outcomes.
3. Do maturity scores differ by asset type or project phase?
Yes. Fleet-intensive projects (e.g., earthmoving) may score differently than projects with heavier labor than asset dependency. Assessments should break down maturity by asset class and execution phase to isolate specific capability gaps rather than relying on an aggregate score.
4. Can a maturity model be tailored for small and midsize contractors?
Absolutely. Smaller firms can use a lightweight version of the maturity model with narrower scope (e.g., one region, one fleet type) and fewer dimensions. The goal is consistent scoring, not complexity, enabling them to prioritize improvements that matter most to their scale.
5. What role does operator training play in advancing maturity?
Operator discipline such as consistent inspection reporting, downtime coding, and status updates is a prerequisite for higher maturity. Without structured training and enforcement, even well-designed processes and tools fail to yield reliable data or predictable performance.
6. How does risk management integrate with maturity assessments?
Maturity is not only about efficiency but also risk mitigation. A structured maturity framework helps identify exposure points such as late inspections, unverified downtime, or unclear ownership, enabling proactive risk control rather than reactive firefighting.
7. Should maturity scoring feed into incentive systems for project teams?
Many advanced organizations tie maturity indicators such as preventive compliance, inspection accuracy, and utilization improvement to performance incentives. This creates alignment between individual behavior and systemic capability improvement.
8. How do external benchmarks factor into maturity evaluation?
While internal benchmarking is necessary first, external benchmarking (against industry or peer groups) can provide context on where an organization stands relative to similar contractors. Accenture's maturity research notes that comparative insights help prioritize where improvement will yield the biggest competitive advantage.
Transform Your Equipment Management

%20How%20to%20Calculate%20It.webp)