Using the Inspection Calendar
What is this?
The Inspection Report (Calendar) shows one row per asset and one icon per day. Each icon tells you if the asset passed its inspection, reported issues, missed an inspection while it was working, or did not run at all. Use it to find missed inspections fast and to follow inspection habits week by week.
Who's this for?
- Equipment managers, see which machines ran without an inspection.
- Safety managers, check inspection completion for audits and safety meetings.
- Superintendents and foremen, follow up with crews that skip inspections.
How to use it
Step 1: Open the report
In the main menu, go to Insights > Reports and click Inspection Report (Calendar).

Step 2: Pick the dates
Click the date button. Choose Day, Week, Month, Year or Custom, then pick the period. You can also use a preset such as Last Week. The report opens on the current month.

Step 3: Read the summary tiles
The tiles count each result for the dates you picked: Missed Inspection, Issues Reported, Non-Operating and Passed. Click a tile to show only the assets with that result. Click it again to show all assets.

Step 4: Choose how rows are grouped
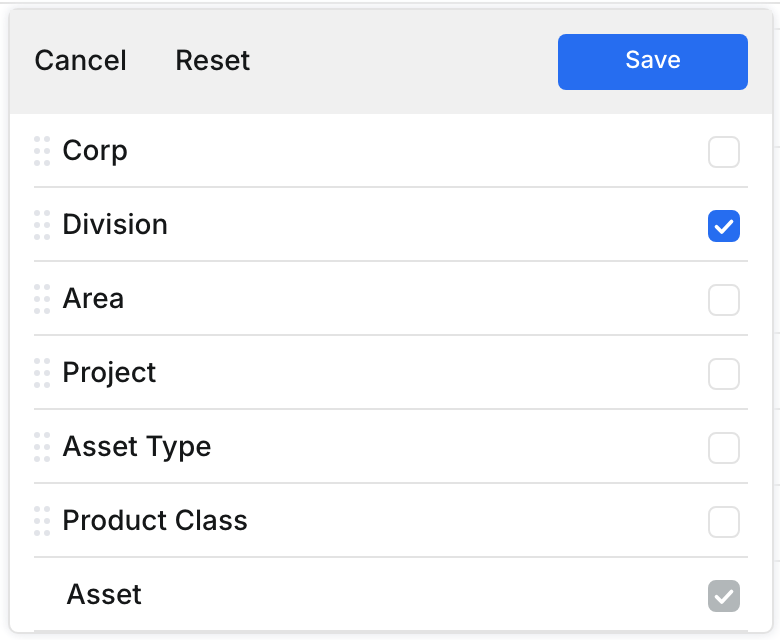
Click Data Structure. Select the levels you want, for example Division, Project or Asset Type. Drag a level to change the order, then click Save.
Step 5: Read the calendar
Click a group to open it and see its assets. Each asset shows its Completion Rate (%) and one icon per day. When there are many assets, use the arrows next to Showing to move to the next page of assets.

Step 6: Check a day
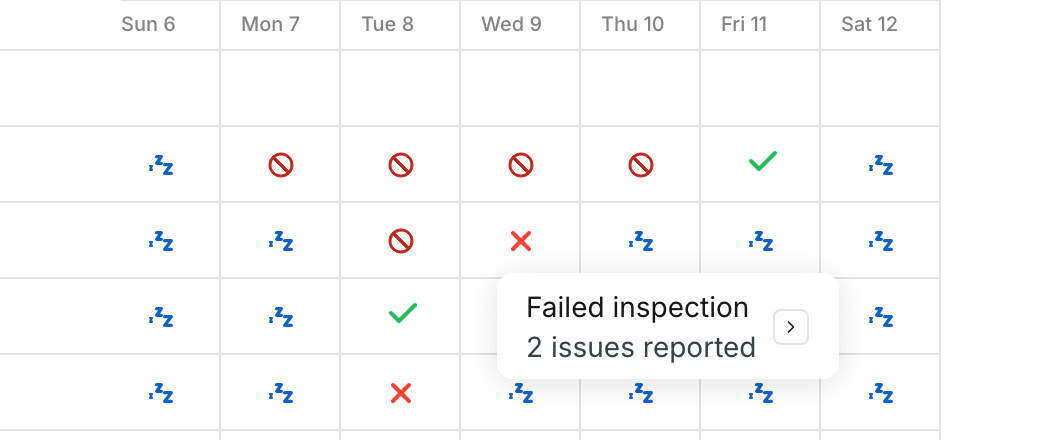
Point to an icon to see what happened that day, for example Failed inspection and the number of issues reported. Click the icon, or the arrow in the tooltip, to open the inspection.
Step 7: Review the inspection
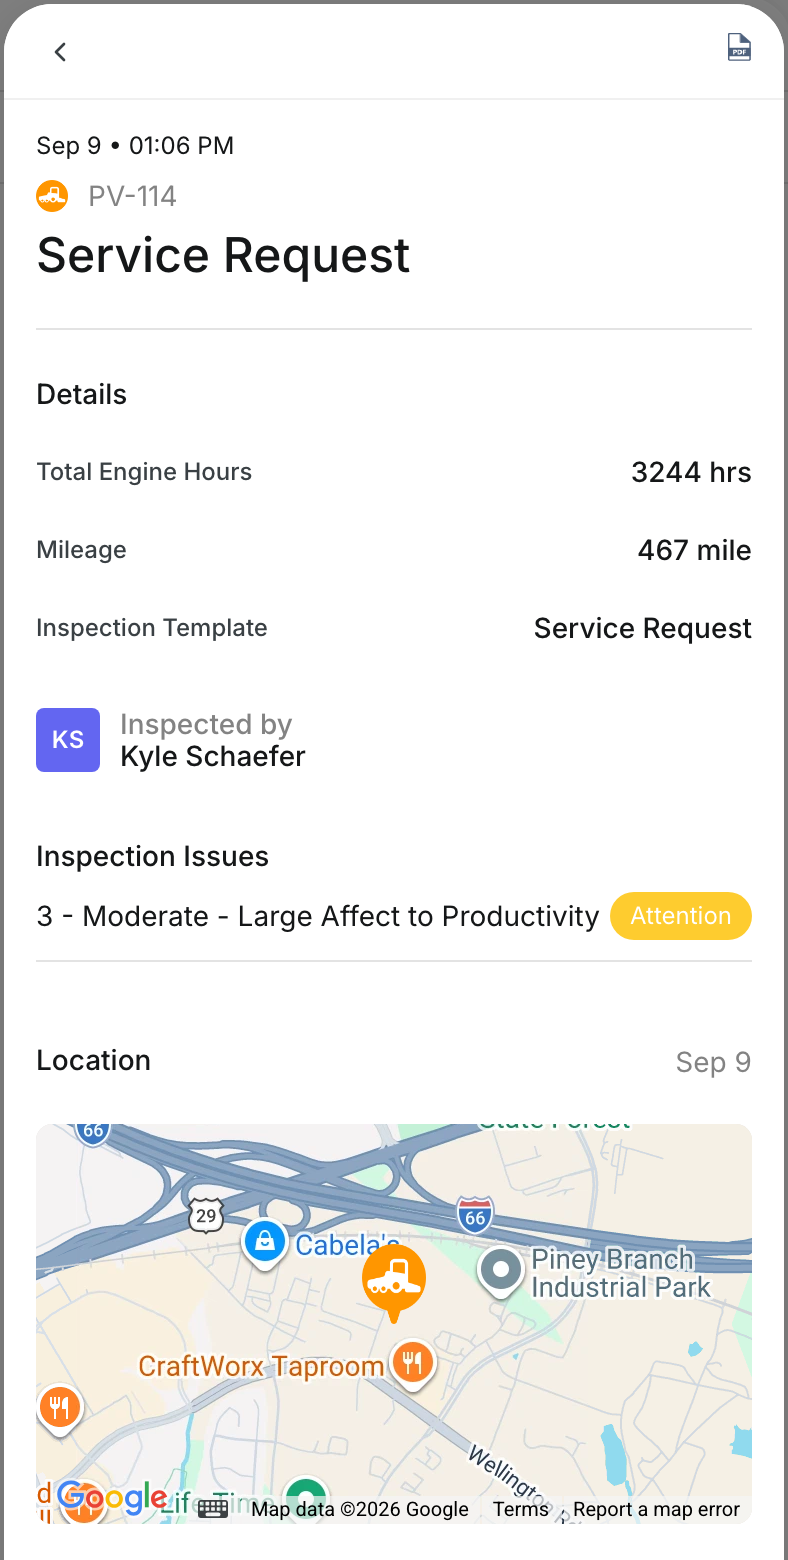
The inspection opens on the right. It shows the date, the template, who inspected the asset, the issues found and the location. Use the PDF icon at the top to download the inspection.
Step 8: Filter the report
Click Filters to narrow the report by organization, project, crew, asset type, product class, inspection template, ownership or inspection result. Under Operational Status, click Edit to change how many hours count as operating.

Step 9: Download, share or schedule
Use the download icon at the top right for Download .xls or Download .csv. The share icon emails the report. Click Schedule Report to get it by email Daily, Weekly or Monthly.


The full details
- Where to find it: Insights > Reports > Inspection Report (Calendar), in the web app.
- Green check (Passed): the asset passed its inspection that day.
- Red cross (Issues Reported): the inspection found issues. The tooltip shows how many.
- Red circle with a line (Missed): the asset worked that day, but nobody inspected it. The tooltip shows the operating hours.
- Blue Zz (Not Operating): the asset did not work and was not inspected, so no inspection was expected.
- Operating: an asset counts as working when it ran more than the hours set under Operational Status in Filters.
- Completion Rate (%): passed and failed days, divided by passed, failed and missed days. Days the asset did not work do not count.
- Group names: the level names in Data Structure come from your company settings, so they can differ from the example.
- Visibility: the report shows in your menu only when your company has it turned on.
Tips
- Review last week every Monday, before small gaps turn into habits.
- Click the Missed Inspection tile to see only the assets that need a follow up.
- Group by Project to compare inspection habits between job sites.
- Schedule a weekly email to your superintendents so they see their own results.