Using Fleet Financials
Fleet Financials gives you one place to review revenue, cost, profitability, and utilization across your fleet. It helps you spot weak areas early, compare parts of the business, and drill down into the assets that are driving the numbers.
Reports section
Fleet Financials sits inside the Insights area and is built for teams that need a financial view of fleet performance, not just maintenance or tracking data. It also fits naturally with Understanding Fleet Reports, Fleet Financials: Fleet Overview, Running the Utilization Report, and Fleet Financials: Asset-Level Analysis and Sweet Spot.
Accessing Fleet Financials
Open Fleet Financials from the Insights section in the sidebar. The Fleet Overview tab loads first and gives you the main summary view for revenue, cost, profitability, and utilization.
Fleet Overview Dashboard
The Fleet Overview is the main screen for reviewing fleet financial performance. It brings together top-level summary cards, a trend chart, alert indicators, and a detail table so you can move from a high-level view into the problem areas quickly.
Summary Cards
At the top of the page, the summary cards show the main numbers for the selected time period. The core cards include Total Revenue, Cost, and Profitability.
Fleet Summary Chart
The summary chart gives you a visual comparison of Revenue, Cost, and Profit over time. Use it to spot trends, compare periods, and see when performance starts to shift.
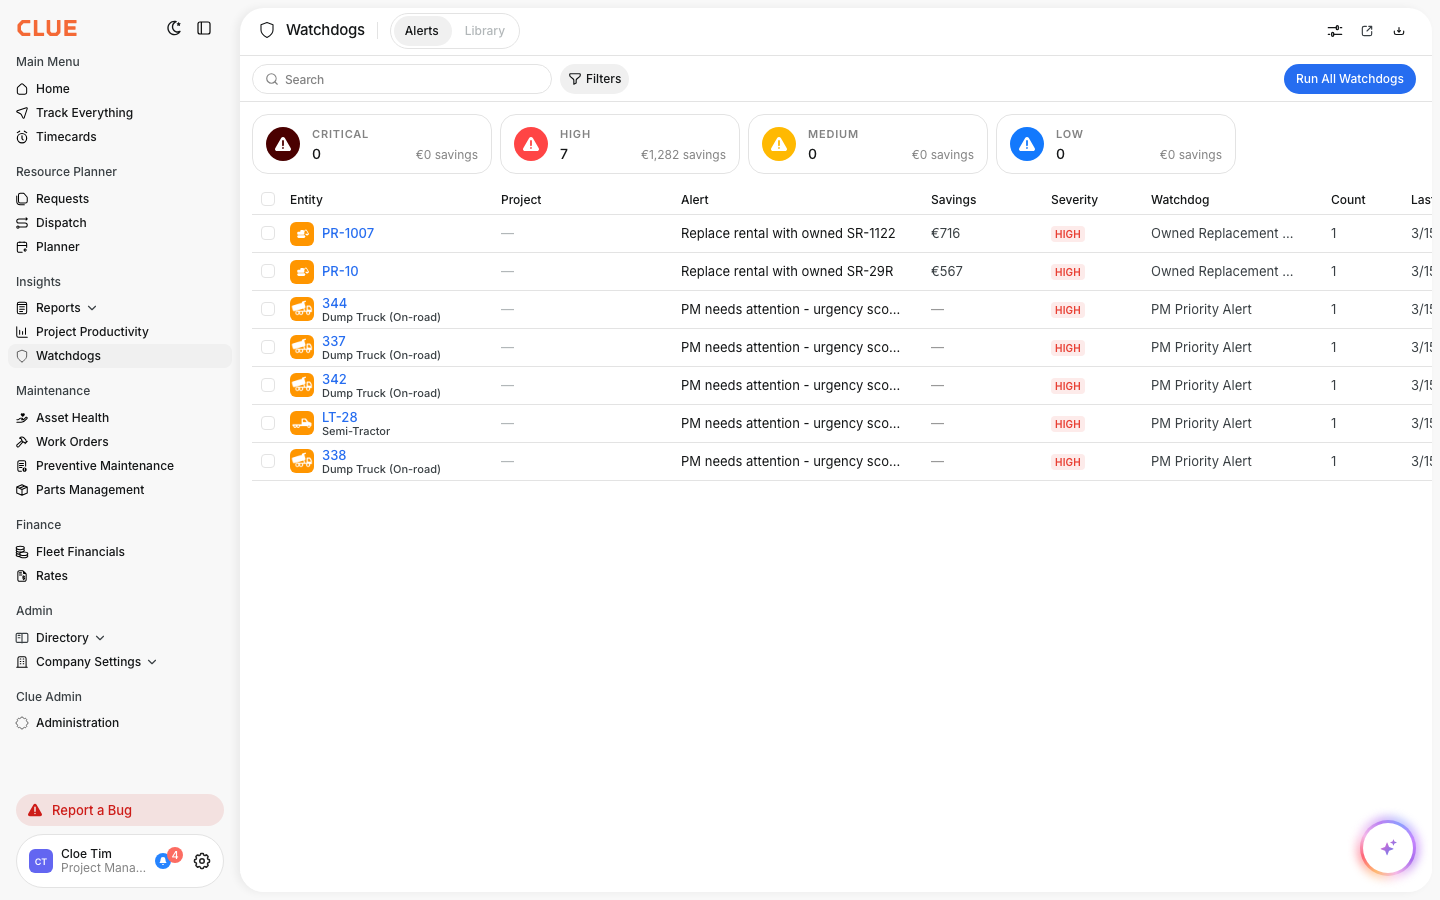
Alert Indicators
Alert indicators help point out areas that need attention. Common examples include Not Profitable and Under Utilization, which help you focus on product groups or assets that are missing targets.
Financial Details Table
The Financial Details table breaks the report into groups like Division and Region, depending on how you set up the view. This is where you move from the top-level numbers into the parts of the fleet that are actually driving the result.
Common columns in the table include:
- Revenue
- Cost
- Gain/Loss
- Profitability
- Active Assets
- Underutilized Assets
- Utilization Rate
Using Filters
Filters help you narrow the report so you can focus on the right part of the business. Use Date Range to change the reporting period, and use Data Structure to group the table by the level that matters most, such as Division, Region, Project, Asset Type, or Product Class.
This is also a good internal linking spot for Running the Utilization Report if the reader wants to focus more on usage and underutilized assets.
Exporting Data
Fleet Financials includes export tools when you need to share or work with the numbers outside CLUE. You can use the download option to export the report to Excel, and CLUE also supports sharing report output in broader reporting workflows.
Tips
A few simple habits make Fleet Financials more useful. The goal is to review the numbers often, focus on the weak spots first, and use the drill-down views to find out what is actually causing the problem.
- Review the report monthly so you can track changes over time.
- Start with Not Profitable and Under Utilization to find the biggest issues first.
- Compare divisions or regions to see where performance is stronger or weaker.
- Drill down into asset-level views when you need to make repair, replace, or utilization decisions.
- Use Fleet Financials: Setting Up Accounting Codes & Uploading Data if your team still needs to load financial data into CLUE.