Understanding Fleet Reports
CLUE’s reporting tools help you review fleet performance, costs, utilization, and activity across the business. Most of these reports live under Insights, where you can move from high-level trends into the details behind a project, asset, or cost category.
Analytics and Reporting
Use CLUE reports when you need more than a live view of the fleet. Reports help you compare usage over time, review financial performance, and share filtered data with operations, maintenance, or project teams. If you are focusing on equipment cost and profitability, start with Fleet Financials: Fleet Overview.
Available Reports
You can open reporting tools from Insights in the main menu. CLUE’s reporting area includes Fleet Financials, Project Productivity, and Reports, which is the custom report builder.
- Fleet Financials - review equipment cost, revenue, and profitability. If you are loading accounting data first, go to Fleet Financials: Setting Up Accounting Codes & Uploading Data.
- Project Productivity - review job site and workforce performance from a project view.
- Reports - build custom views when you need something outside the standard dashboards.
Track Everything Dashboard
Track Everything gives you a live map view instead of a historical report. It is useful when you need to see where assets are right now, along with current activity and alerts, before moving into deeper reporting. If you want the full map workflow, open Using Track Everything.
In Track Everything, teams can review:
- live asset locations on the map
- active work orders
- current alerts and notifications.
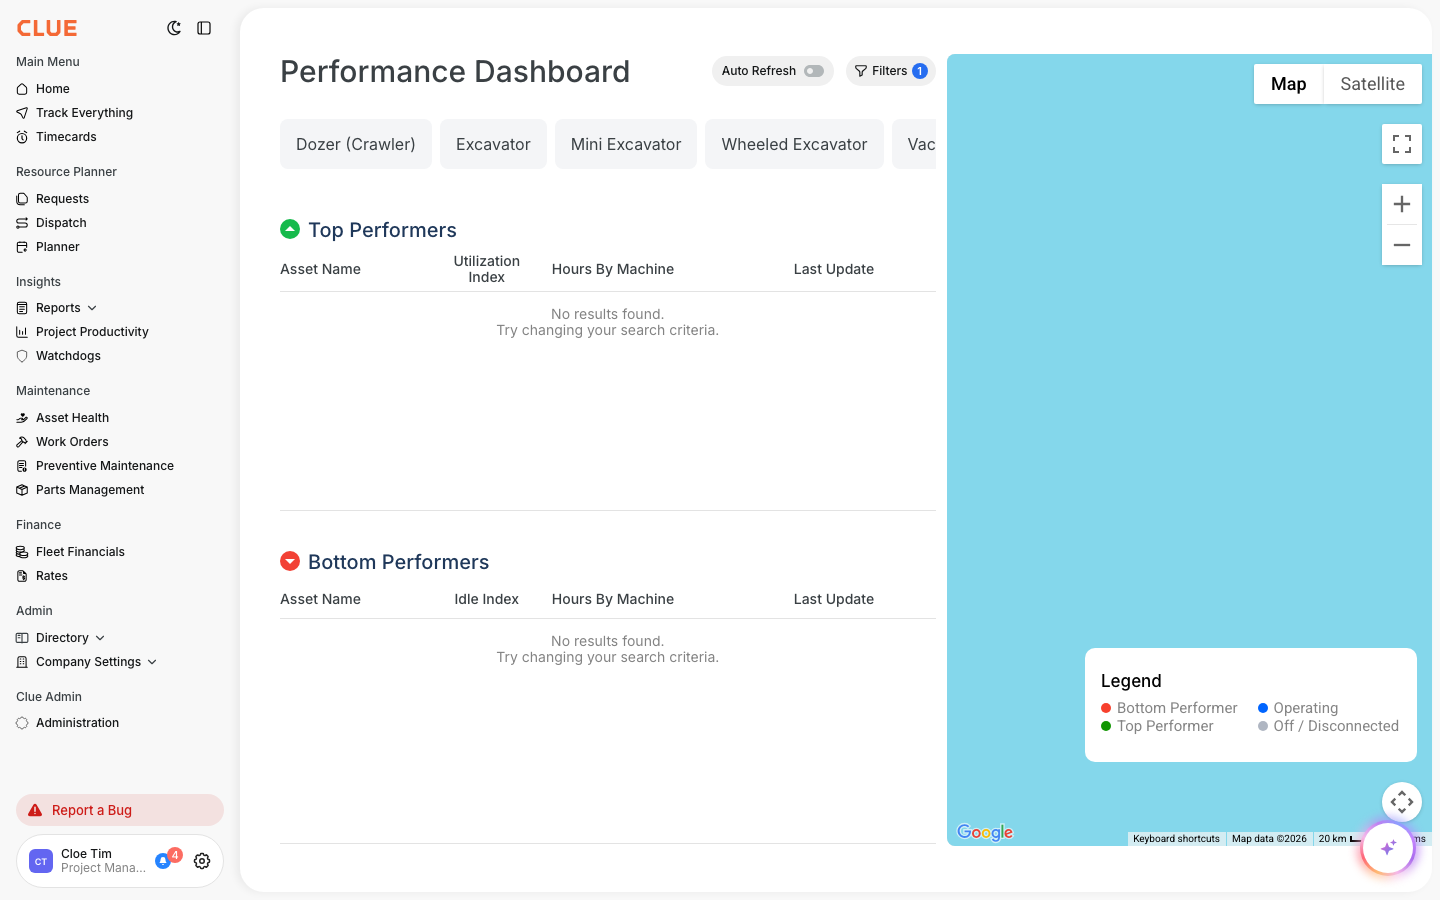
Utilization Report
Use the Utilization Report when you want to understand how hard equipment is working and where there may be unused capacity. CLUE’s live report pages describe it as part of the Fleet Financials reporting workflow, with operational metrics that help you spot underused assets and compare actual usage against expected demand. If you need the full walkthrough, go to Running the Utilization Report or Understanding the Asset Utilization Report.
Depending on the view and filters, the Utilization Report can help you review:
- labor hours by person or crew
- equipment usage hours
- capacity versus actual utilization.
Exporting Data
CLUE’s reporting tools support exporting data after you apply the filters you want. This is useful when you need to share a view with someone else or keep a copy for operations, finance, or project review.
A normal export flow is:
- apply the filters you want
- click the download or export action
- choose the file format when available
- download the report or send it to others.
If your team reviews the same report often, it can be helpful to save that workflow alongside the related report article, such as Fuel Reports and Analytics for fuel-related reporting or Fleet Financials: Fleet Overview for cost reporting.
Custom Date Ranges
Most reporting is only useful if the date range is right. CLUE’s reporting pages support filtered views, so teams can look at short windows like the last week or broader periods like a month, quarter, or year, depending on what they are reviewing.
Use date filters when you want to:
- compare recent activity
- review a pay period or accounting period
- look at month-end or quarter-end trends
- focus on one project window instead of the full year.