Running the Utilization Report
Use the Utilization Report in Fleet Financials to see how equipment is performing across your fleet. It helps you spot underused assets, compare usage trends, and review the financial impact of utilization over time.
Understanding Fleet Utilization
The Utilization Report is part of CLUE’s Fleet Financials reporting area. It combines utilization data with financial metrics, so you can review equipment performance and cost in the same place. If you want the bigger picture first, start with Understanding Fleet Reports or Fleet Financials: Fleet Overview.
Accessing the Report
Open Fleet Financials from the main navigation. CLUE’s Fleet Overview loads by default, and that view includes utilization data and related financial metrics. If you need a broader walkthrough of the module first, Using Fleet Financials is the best place to start.
Key Metrics Displayed
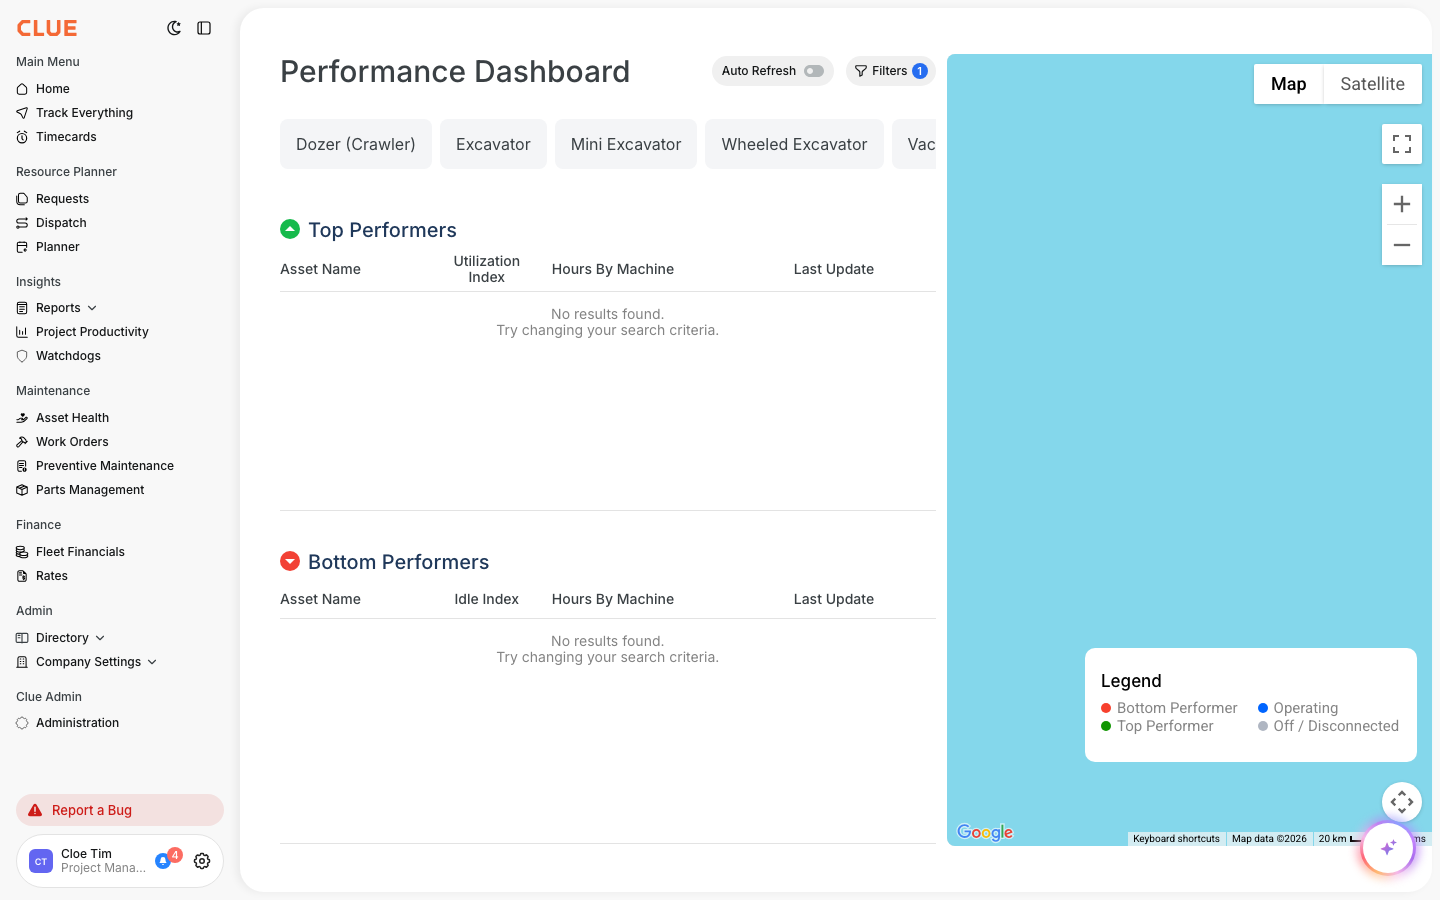
The Fleet Overview shows a set of summary metrics that help you understand overall fleet performance. CLUE’s live Fleet Financials pages highlight metrics such as Total Revenue, Cost, Profitability, Active Assets, Underutilized Assets, and Utilization Rate.
These metrics work together. Revenue and cost show the financial side, while utilization and underutilized asset counts show whether equipment is actually being used the way you expect. If you also want to set usage goals for each machine, the natural next step is Setting Utilization Targets.
Understanding the Financial Details Table
The detail table breaks the report down into smaller groups so you can move past the high-level totals. Depending on your view and filters, CLUE’s Fleet Financials reporting lets you review values like revenue, cost, profitability, active asset counts, underutilized assets, and utilization rate at lower levels of the fleet.
This is where the report becomes more useful for decision-making. You can start at the fleet level, then drill down into divisions, product classes, and individual assets to see where performance is strong and where it is slipping. If you need to go all the way to one machine, open Fleet Financials: Asset-Level Analysis and Sweet Spot from there.
Using the Utilization Filters
Filters help you focus on the assets that need attention instead of scanning the whole fleet every time. CLUE’s live Utilization Report article points to filters for problem areas such as Not Profitable and Under Utilization, which help surface assets that are not meeting financial or usage expectations.
You can also use the report filters to narrow the view by time period and fleet grouping. That makes it easier to review one division, one region, or one reporting window instead of mixing everything together. For a deeper explanation of what each utilization number means, Understanding Utilization Metrics fits naturally here.
Tips
Use the date range filter to match the period you actually want to review, especially when you are comparing months or quarters. Export the report when you need to share the data or work with it outside CLUE, and review underutilized assets regularly so low usage does not go unnoticed for too long.
If you notice an asset is showing up as underused again and again, compare the report with Fleet Financials: Fleet Overview and Setting Utilization Targets before making a fleet decision. That gives you a better view of whether the problem is truly low demand, poor deployment, or a target that needs to be adjusted.