Available now on Beta. This feature is in beta testing and will roll out to everyone soon.
What is this?
The Spending tab turns your rentals into a cost picture. See total rental spend, how it trends over time, and how it breaks down across your business. It answers "what are we spending on rentals" without a spreadsheet.

Who's this for?
- Equipment managers, to track what the company spends on rented equipment.
- Project managers, to see the rental cost of each project.
- Finance and accounting, to review rental spend by vendor, project or month.
- Executives, to watch rental cost trends across divisions and regions.
How to use it
Step 1: Open the Spending tab
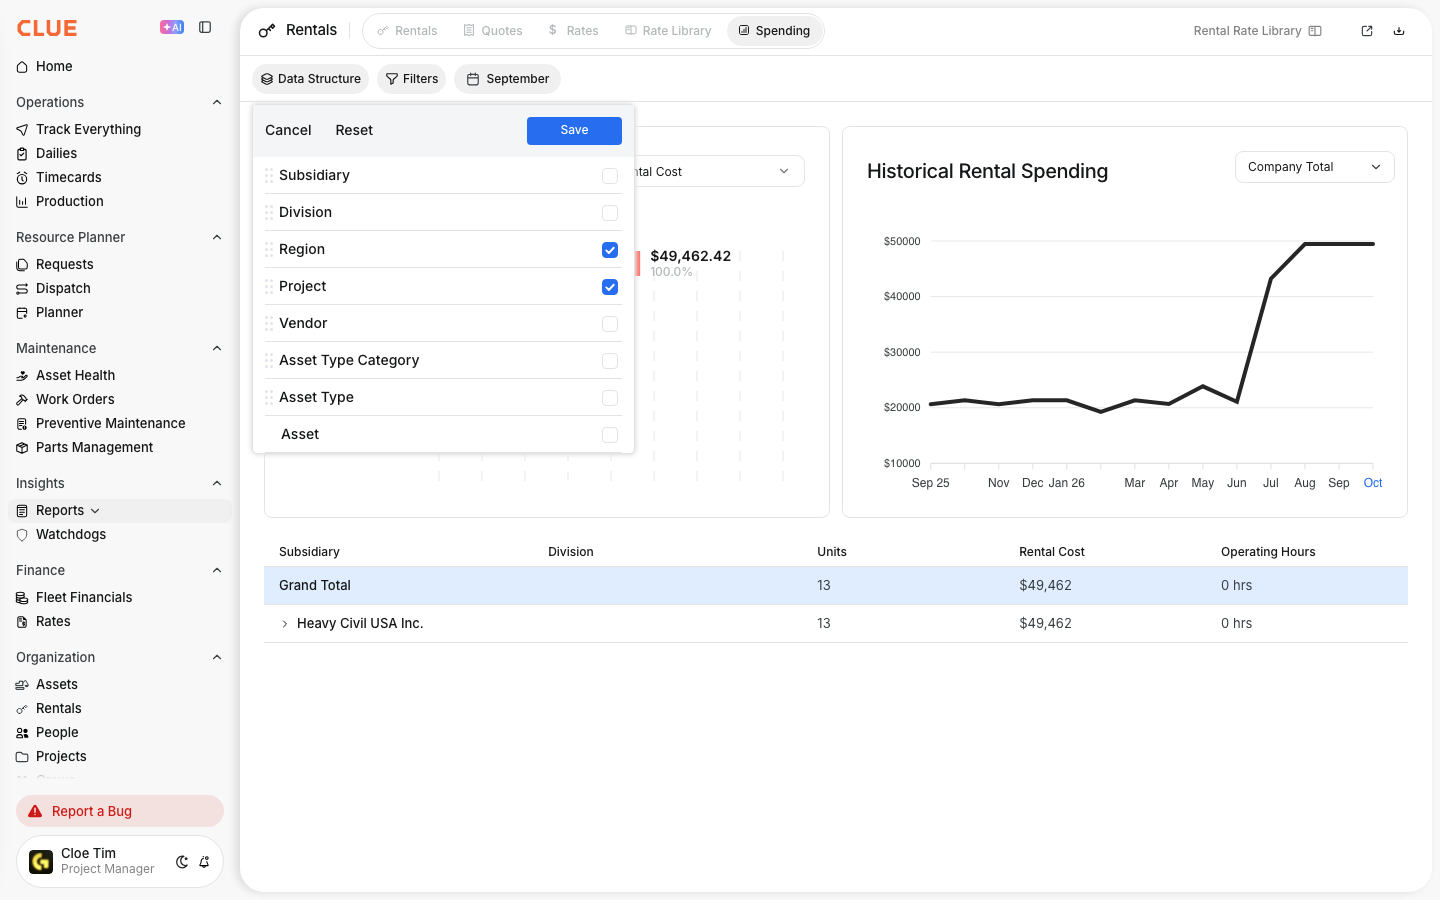
Go to Rentals, then the Spending tab. You see total rental cost, a historical spend chart, and a breakdown table.

Step 2: Filter to what matters
Use Data Structure, Filters, and the date range to focus on a division, region, or time window. The chart and totals update to match.


The full details
- Where to find it: Go to Rentals, then the Spending tab. If you do not see the tab, ask your Clue admin.
- What you see: You see only the rentals your role lets you see.
- Rental Spending chart: Shows Total Cost for the period. Switch between Rental Cost and Number of rental assets.
- Historical Rental Spending chart: Shows Company Total by default. Pick groups to compare, up to the selection limit shown.
- Data Structure: Group costs by your organization levels, Project, Vendor, Asset Category, Asset Type or Asset.
- Filters: Narrow the view by affiliated organization, Project, Vendor and Asset Type.
- Date range: Pick a month or a full year. The tab opens on the current month. Future dates are not available.
- Breakdown table: Lists Units, Rental Cost and Operating Hours for each group, with a Grand Total.
- Currency: Costs show in your currency. Clue converts other currencies at the rate on the first day of the date range.
- Share and download: Email the report to your team, or download it as a CSV or Excel file. Both use your current filters.
Tips
- Group by Vendor to see which vendors take the biggest share of your spend.
- Pick a full year to spot seasonal peaks in rental cost.
- Switch the chart to Number of rental assets to compare fleet size with cost.
- Rows marked Unassigned are rentals with no value for that group. Assign them to get a cleaner picture.
- Set your filters before you share or download, so the file matches what you see.


