What Is Total Effective Equipment Performance? How to Calculate


Hi, I’m Maham Ali. I write about construction equipment management, helping teams use fleet data and maintenance intelligence to improve uptime, control costs, and run smoother jobsites.
Most construction companies already track equipment metrics in some form. They monitor engine hours, fuel consumption, idle time, maintenance schedules, and utilization rates. Some fleets even have advanced telematics systems feeding live operational data into dashboards every minute.
Yet despite all that visibility, many contractors still struggle to answer a basic operational question: How much of an equipment asset’s total possible time is actually producing valuable work?
That is the purpose of Total Effective Equipment Performance, commonly known as TEEP.
That distinction is important in construction because heavy equipment ownership has become significantly more expensive over the last decade. Contractors are dealing with rising acquisition costs, tighter project schedules, higher financing rates, emissions regulations, labor shortages, and increasingly complex service requirements.
As a result, fleet managers are under pressure to extract more productivity from existing assets before purchasing additional machines. Simply owning more equipment is no longer an efficient operational strategy if current assets are not being fully utilized.
This is where TEEP becomes valuable.
What is Total Effective Equipment Performance (TEEP)?
.webp)
Total Effective Equipment Performance (TEEP) is a metric that measures how effectively construction equipment converts total available time into productive work. It evaluates equipment based on four factors: availability, performance, quality, and utilization.
Unlike standard utilization metrics that only track whether a machine was active, TEEP measures whether the equipment was operating efficiently, producing acceptable output, and being fully used across total calendar time.
Why TEEP Matters in Construction Equipment Operations?
Construction operations are fundamentally different from manufacturing environments where many equipment efficiency metrics originally became popular.
Manufacturing systems operate in relatively controlled conditions. Production lines remain fixed, workflows are standardized, and operating variables are easier to predict.
Construction equipment rarely operates under those conditions.
A single excavator may work across multiple projects within a month while dealing with changing terrain, weather conditions, crew coordination issues, transport delays, varying operator skill levels, fuel logistics, and shifting project schedules.
Because of that complexity, many construction fleets develop operational blind spots that are difficult to identify using traditional metrics alone.
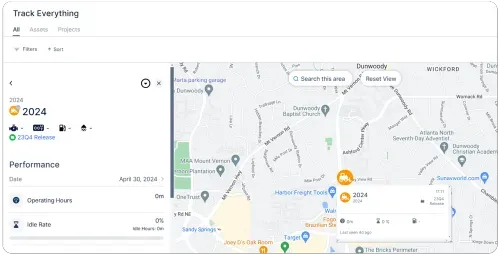
This is also why more construction companies are moving toward connected fleet operations platforms like Clue, which combine equipment tracking, inspections, maintenance, dispatching, and equipment utilization visibility into a single operational system. Without centralized visibility, identifying true equipment effectiveness becomes significantly harder across active jobsites.
For example, a machine may appear heavily utilized because the engine is running throughout the day. However, the same equipment could still be losing substantial productivity due to:
- Excessive idling
- Delayed truck coordination
- Slow loading cycles
- Rework
- Poor dispatch timing
- Frequent standby periods
- Unplanned service interruptions
Standard engine-hour tracking does not reveal those losses clearly. TEEP does because it evaluates both operational performance and overall time utilization together.
Understanding the Core TEEP Formula
The standard TEEP formula is:
TEEP = Availability × Performance × Quality × Utilization
It can also be expressed as:
TEEP = OEE × Utilization
Where:
- OEE stands for Overall Equipment Effectiveness
- Utilization measures how much of total calendar time equipment was scheduled for production
At first glance, the formula appears straightforward. However, accurately calculating each component becomes much more difficult in real-world construction operations where machines are mobile and operational conditions constantly change.
To understand TEEP properly, each component needs to be broken down individually.
The Difference Between OEE and TEEP
OEE and TEEP are closely related, but they answer different operational questions.
OEE asks:
Did the equipment perform efficiently while it was scheduled to operate?
TEEP asks:
How much of the equipment’s total possible capacity are we actually using?
That distinction matters heavily in construction because many companies purchase additional machines when the real issue is poor utilization of existing assets.
Understanding that difference is where TEEP becomes strategically valuable for fleet planning, dispatching, maintenance coordination, and long-term capital decisions.
Where OOE Fits Between OEE and TEEP
OEE, OOE, and TEEP are closely related metrics, but they measure equipment effectiveness across different levels of operational time.
- OEE (Overall Equipment Effectiveness) measures productivity during planned production time, the scheduled operating window after planned downtime (breaks, changeovers, scheduled maintenance) has been excluded.
- OOE (Overall Operations Effectiveness) expands the measurement window to include planned downtime such as maintenance, breaks, and changeovers.
- TEEP (Total Effective Equipment Performance) expands the measurement window further to include total calendar time, including unscheduled hours.
The Four Core Components of TEEP

Total Effective Equipment Performance is built around four operational measurements that work together to show how effectively construction equipment is being used across total available time.
Understanding each TEEP component properly is what prevents fleets from making expensive misinterpretations about utilization, downtime, and asset performance.
Component 1: Availability
Availability measures how often equipment was operational during planned production time.
The formula is:
Availability = Run Time ÷ Planned Production Time
If an excavator was scheduled to operate for 10 hours but experienced two hours of downtime due to mechanical issues and inspections, the machine’s runtime becomes eight hours.
The availability calculation would look like this:
Availability = 8 ÷ 10 = 80%
Availability is often associated with mechanical reliability, but in construction operations, downtime is not always caused by equipment failure.
Many availability losses are operational.
For example, a healthy machine may still remain inactive because:
- Haul trucks are delayed
- Operators are unavailable
- Fuel deliveries arrive late
- Site access is restricted
- Attachments are not ready
- Supervisors pause operations
- Safety inspections interrupt production
This distinction matters because many fleets incorrectly assume low availability automatically indicates poor machine reliability. In reality, the equipment itself may not be the primary issue.
Operational coordination often has a larger impact on availability than mechanical breakdowns.
Hidden Availability Losses Most Fleets Ignore
One of the reasons TEEP has become increasingly valuable is because it exposes operational inefficiencies that traditional maintenance reporting tends to overlook.
Some of the most damaging availability losses in construction are not dramatic breakdowns. They are smaller recurring interruptions that slowly reduce productive hours throughout the week.
Equipment Waiting for Supporting Assets
- A loader may sit inactive because haul trucks are not cycling efficiently.
- An excavator may stop digging because pipe crews are behind schedule.
- A crane may remain idle because materials have not arrived.
- The equipment is technically functional, but productivity still stops.
Delayed Service Response
Minor maintenance issues often become extended downtime events because approval chains, technician availability, or parts procurement slow the repair process.
A hydraulic hose replacement that should require 30 minutes can easily consume half a day operationally.
Fueling Inefficiencies
Fuel management inefficiencies are far more expensive than many contractors realize.
Equipment frequently loses productive time waiting for fuel trucks, traveling to fueling locations, or sitting inactive because refueling schedules were poorly coordinated across jobsites.
Transportation and Mobilization Delays
Construction fleets frequently lose productive hours because equipment arrives late to projects or spends excessive time moving between sites.
These losses rarely appear clearly in standard maintenance reports, but they directly reduce TEEP performance.
Component 2: Performance
Performance measures whether equipment operated at expected production speed while it was running.
The formula is:
Performance = (Ideal Cycle Time × Total Output) ÷ Run Time
This component is particularly important because equipment can appear operational while still performing inefficiently.
For example, a haul truck may remain active throughout an entire shift, but if traffic routing, loading inefficiencies, or poor dispatch coordination increase cycle times, actual production throughput drops significantly.
The truck is technically operating. However, it is not operating effectively.
That distinction is critical.
Common Performance Losses in Construction Equipment
Performance losses are often harder to detect than downtime because machines still appear busy.
In reality, productivity may be declining throughout the day due to operational inefficiencies that are difficult to identify without detailed data analysis.
Excessive Idling
Idling remains one of the largest hidden productivity drains in construction fleets. Beyond fuel consumption, excessive idling also creates:
- Unnecessary engine wear
- Faster maintenance interval accumulation
- Higher emissions output
- Reduced component lifespan
More importantly, idle time creates a false perception of utilization because equipment appears active despite generating no productive work.
Slow Operating Cycles
Cycle inefficiencies can significantly reduce production output even when machines remain operational.
Examples include:
- Underloaded haul trucks
- Long travel routes
- Repeated grading corrections
- Poor bucket fill efficiency
- Congested loading zones
- Inconsistent operator techniques
Small delays repeated hundreds of times per week can dramatically reduce equipment productivity.
Micro-stoppages
Micro-stoppages are short operational interruptions that rarely get documented formally but collectively consume large amounts of productive time.
These may include:
- Waiting for instructions
- Spotter delays
- Material shortages
- Crew coordination gaps
- Temporary site restrictions
- Brief safety pauses
Individually, these interruptions seem insignificant. Operationally, they can destroy production efficiency across an entire fleet.
Component 3: Quality
Quality measures how much completed work meets acceptable operational standards without requiring rework or correction.
The formula is:
Quality = Good Output ÷ Total Output
Construction companies often associate quality metrics with manufacturing defects, but equipment-related quality losses are extremely common on jobsites.
Whenever work must be corrected, repeated, or redone, equipment productivity declines because additional machine hours are consumed without creating new project progress.
Examples of Quality Losses in Construction Operations
- Regrading and rework: Dozers frequently perform additional passes because grade targets were missed initially.
- Failed compaction: Compaction equipment may need repeated cycles when density requirements are not achieved properly.
- Overexcavation: Excavators removing excess material create unnecessary hauling, fuel consumption, and additional labor requirements.
- Incorrect trench dimensions: Improper excavation depth or width often requires corrective work that consumes additional equipment time.
- Asphalt and paving inconsistencies: Poor paving quality can require rework, additional rolling, or material replacement.
Component 4: Utilization
Utilization is the factor that separates TEEP from traditional OEE calculations. It measures how much of the total available calendar time equipment was actually scheduled for production.
The formula is:
Utilization = Planned Production Time ÷ Total Calendar Time
For example, if a machine operates:
- 10 hours daily
- 5 days per week
Its planned operating time equals: 50 hours weekly
Since a full calendar week contains 168 hours:
Utilization = 50 ÷ 168 = 29.7%
This means the machine could never achieve a TEEP score above 29.7% even if it operated perfectly during scheduled hours. That concept surprises many contractors initially because TEEP values are naturally lower than standard OEE values.
However, the metric becomes extremely valuable because it reveals unused operational capacity that standard utilization reporting often misses.
Why TEEP Scores Are Usually Lower Than Expected?
Many construction fleets incorrectly assume low TEEP percentages indicate operational failure.
That is not necessarily true.
Construction operations rarely run continuously across 24-hour schedules, which means equipment naturally spends large portions of calendar time inactive.
In equipment-heavy operations, directional TEEP ranges may look like this, depending on shift structure, asset type, and jobsite conditions:
These ranges should be treated as planning references, not fixed construction benchmarks.
A contractor operating one daytime shift may still be performing efficiently with a TEEP score around 25%.
The value of the metric comes from identifying where additional productive capacity exists, not from chasing unrealistic percentages.
How to Calculate TEEP in Construction Equipment Operations?

Understanding the four components of TEEP is important. However, the real value comes from knowing how to calculate the metric accurately in live construction environments where equipment moves constantly between projects, crews, and operating conditions.
This is where many contractors struggle.
Most fleets already collect huge amounts of operational data through:
- Telematics systems
- GPS tracking
- PM software
- Fuel platforms
- Inspection apps
- Operator logs
- Dispatch systems
The problem is that the data usually exists in isolation.
As a result, companies often calculate utilization incorrectly, overestimate runtime, or completely miss hidden productivity losses happening across the field.
Calculating TEEP properly requires operational context, not just machine data.
Step-by-Step TEEP Calculation Example
To understand how TEEP works practically, consider a realistic construction scenario involving a crawler excavator operating on a large utility installation project.
Step 1: Determine Total Calendar Time
TEEP starts by measuring total possible available time.
A full calendar week contains: 168 total hours
This is important because TEEP evaluates equipment against maximum possible availability, not just scheduled shift hours. Unlike OEE, which only looks at planned operating time, TEEP evaluates the full calendar window.
Step 2: Calculate Planned Production Time
Suppose the excavator is scheduled for:
- 12-hour shifts
- 5 days per week
That creates: 60 planned operating hours
This number becomes the basis for utilization calculations later.
Step 3: Measure Actual Runtime
Now the fleet must determine how many of those planned hours were truly operational. During the week, the excavator loses time because of:
- Hydraulic issue: 3 hours
- Fueling delays: 1 hour
- Inspection hold: 1 hour
- Crew coordination delay: 1 hour
- Total downtime becomes: 6 hours
Actual runtime therefore equals:
60 - 6 = 54 runtime hours
Step 4: Calculate Availability
The formula is:
Availability = Run Time ÷ Planned Production Time
So:
54 ÷ 60 = 90%
The excavator achieved 90% availability during scheduled production time.
Step 5: Calculate Performance
Next, the contractor evaluates whether the excavator operated at expected production speed.
Suppose telematics and production reports show:
- Longer-than-normal trench cycles
- Increased idle periods
- Delayed spoil hauling
- Reduced bucket efficiency in wet soil conditions
Using cycle count data pulled from the telematics system, the site supervisor compares actual bucket cycles completed against the daily production target. The excavator averaged 84 completed cycles per hour against an expected rate of 100 cycles per hour under normal soil and hauling conditions. That gap reflects the combined impact of the delays and inefficiencies recorded during the week.
The calculation becomes:
Performance = 84 ÷ 100 = 84%
Step 6: Calculate Quality
Next comes quality evaluation. Suppose several trench sections required correction because of inconsistent excavation depth.
After reviewing completed work, supervisors determine:
Quality = 95%
That means 95% of the excavator’s production output met acceptable standards without rework.
Step 7: Calculate OEE
Now the first three components are combined.
OEE = Availability × Performance × Quality
So:
90% × 84% × 95%= 71.8%
The excavator’s operational efficiency during scheduled production time was 71.8%.
Step 8: Calculate Utilization
Next comes utilization.
The formula is:
Utilization = Planned Production Time ÷ Total Calendar Time
So:
60 ÷ 168 = 35.7%
The excavator was only scheduled to operate during about one-third of total available weekly time.
Step 9: Calculate Final TEEP
Finally:
TEEP = OEE × Utilization
So:
71.8% × 35.7% = 25.6%
The excavator delivered productive, quality work during approximately 25.6% of total available calendar time.
That number initially sounds low to many contractors. Operationally, however, it is fairly realistic for single-shift construction environments.
Why Idle Time Distorts Equipment Performance Metrics?

Idle time is one of the largest hidden operational losses in construction equipment management. Excessive idling contributes to:
- Fuel waste
- Engine wear
- Maintenance costs
- Unnecessary emissions
- Shortened component lifespan
More importantly, idle-heavy fleets frequently appear “utilized” despite low productivity.
For example: A dozer may remain powered on for 9 hours.
However:
- 3 hours may involve active grading
- 2 hours may involve standby waiting
- 2 hours may involve operator breaks
- 2 hours may involve congestion delays
Without operational context, utilization reporting becomes distorted. TEEP helps expose those hidden inefficiencies.
Clue focuses on connecting the operational workflows that directly affect TEEP. For example, inspection workflows can help identify availability issues before they become major downtime events, while dispatch visibility reduces standby time between crews and projects.
Equipment maintenance software improves uptime planning, while centralized asset visibility makes it easier to identify underutilized equipment across jobsites.
Together, these workflows provide better operational context around how equipment is actually performing in the field.

Benefits of Measuring TEEP in Construction Operations
TEEP gives contractors a more accurate view of how effectively equipment is being used. Unlike standard utilization metrics, it does not just measure whether a machine was active. It measures whether the equipment was available, productive, operating efficiently, and generating acceptable output.
That broader visibility creates several operational advantages.
1. Better Equipment Utilization Decisions
Many contractors assume they need additional equipment when projects begin falling behind. TEEP helps determine whether the real issue is insufficient fleet capacity or poor use of existing assets. In many cases, equipment is available but underutilized because of scheduling gaps, idle-heavy operations, dispatch inefficiencies, or standby delays between crews.
2. Lower Cost Per Productive Hour
Heavy equipment generates ownership costs whether it is productive or not. Financing, insurance, depreciation, transportation, and preventive maintenance continue regardless of utilization levels. Improving TEEP increases the amount of productive work generated from those fixed costs, which lowers cost per productive operating hour.
3. Reduced Fuel Waste and Idle Time
TEEP exposes operations where machines spend large portions of the day idling or waiting instead of producing work. That helps fleets reduce unnecessary fuel burn, excessive engine hours, and avoidable maintenance accumulation.
4. Stronger Maintenance Planning
TEEP helps maintenance teams identify whether downtime losses are being caused by equipment reliability problems or operational coordination issues.
That distinction improves preventive maintenance scheduling and reduces unnecessary service interruptions during peak production periods.
5. Better Fleet Planning
TEEP gives contractors better visibility into which equipment categories are consistently productive and which assets spend excessive time inactive.
This improves decisions around fleet expansion, rentals, equipment replacement, and long-term capital planning.
Why TEEP Matters for Equipment Purchasing Decisions?

One of the most valuable uses of TEEP is identifying whether a contractor truly needs additional equipment capacity. Many fleets purchase new assets because projects feel equipment-constrained operationally.
However, TEEP analysis often reveals that the actual problem is:
- Poor utilization,
- Inefficient scheduling,
- Fragmented dispatching,
- or operational downtime.
For example, a contractor may believe another excavator is needed because crews regularly experience delays.
After analyzing TEEP, the company may discover:
- Existing excavators spend large portions of the week inactive
- Idle-heavy operations reduce throughput
- Dispatching creates bottlenecks between projects
- Maintenance scheduling interrupts peak production windows
In that scenario, improving operational coordination may produce better ROI than expanding the fleet. This becomes especially important as equipment acquisition costs continue rising across the industry.
Who Should Use TEEP in Construction Operations?
TEEP and OEE are both valuable metrics, but they are designed for different people within a construction operation. Understanding who should use each metric prevents misapplication and ensures the right insights reach the right decision-makers.
OEE is for field supervisors and operators.
OEE measures how efficiently equipment performed during scheduled operating time. Operators and site supervisors can directly influence those outcomes through better cycle management, reduced idle time, and improved coordination during active shifts. OEE gives them a clear performance picture for the hours they are responsible for.
TEEP is for fleet managers and executives.
TEEP measures how much of total calendar time equipment is converting into productive output. That broader perspective is most useful for people making decisions about fleet size, equipment purchases, shift scheduling, and long-term capital allocation.
A fleet manager reviewing TEEP across a group of excavators can identify whether machines are consistently underutilized before approving a new equipment purchase. An operations director reviewing TEEP trends across multiple projects can identify whether scheduling gaps or dispatching inefficiencies are limiting overall fleet productivity.
Holding daily operators accountable for TEEP scores creates the wrong incentives. Operators cannot control customer demand, project scheduling, or dispatch coordination. Assigning TEEP responsibility to the wrong level of the organization leads to poor decisions rather than meaningful improvement.
The right approach is using both metrics together. OEE tells supervisors how well equipment ran during scheduled hours. TEEP tells leadership how much of the total available fleet capacity is actually being used.
How to Track TEEP Over Time?

A single TEEP score does not tell the full story. The real value comes from tracking it consistently over time and identifying whether equipment productivity is improving, declining, or staying flat.
A declining TEEP trend is always worth investigating. A stable or improving trend confirms that operational changes are working. The right tracking frequency depends on the scale of operations.
Weekly tracking works well for active fleets moving between projects frequently. Monthly tracking suits fleets on longer project schedules where week-to-week variation is expected. Quarterly tracking is useful for high-level fleet planning and capital decisions.
When TEEP drops, contractors should examine which component is driving the decline whether availability, performance, quality, or utilization before drawing conclusions. That targeted visibility is what makes TEEP a practical management tool rather than just another dashboard number.
Why Fragmented Systems Reduce TEEP Visibility?
One of the largest barriers to accurate TEEP analysis is disconnected operational software.
Construction data often lives across separate systems including:
- Telematics platforms
- Fuel software
- Inspection tools
- Dispatch boards
- Maintenance systems
- Spreadsheets
- Operator logs
As a result, companies may see isolated metrics without understanding how operational problems connect together.
For example:
A fleet may identify high idle time but fail to connect it to:
- Poor dispatch timing.
- Delayed truck coordination.
- Or inefficient loading workflows.
This is where a single operational platform becomes more important.
Connected workflows make TEEP easier to understand because each workflow supports a specific part of the TEEP calculation.

Why TEEP Is Difficult to Measure in Construction?
TEEP provides valuable operational insight, but measuring it accurately in construction environments is much harder than many fleets expect. Unlike manufacturing operations with fixed production systems, construction equipment operates across changing jobsites, crews, schedules, and working conditions.
Several factors make accurate TEEP measurement difficult:
- Fragmented operational data: Equipment data is often spread across telematics systems, maintenance software, fuel platforms, inspections, dispatch tools, and spreadsheets, making it difficult to build a complete operational picture.
- Inconsistent runtime tracking: Many fleets classify engine-on time as productive runtime even when machines are idling, waiting for crews, paused between tasks, or sitting inactive on jobsites.
- Limited production visibility: GPS movement and engine activity can show that equipment was active, but they do not explain whether the machine was generating productive output efficiently.
- Difficulty measuring quality losses: Rework, failed compaction, grading corrections, and overexcavation frequently consume machine hours without being tracked clearly in operational reporting.
- Changing jobsite conditions: Weather, terrain, congestion, material conditions, and crew coordination constantly affect production efficiency, making standardized benchmarking difficult.
- Mixed fleet complexity: Excavators, cranes, haul trucks, compactors, and dozers all operate with different cycle patterns, utilization expectations, and performance behaviors.
- Disconnected operational workflows: Downtime, dispatching, inspections, maintenance planning, and utilization tracking often exist in separate systems, which limits operational visibility across the fleet.
How Contractors Can Improve TEEP?

Improving TEEP usually does not require one major operational change. Instead, the biggest gains often come from reducing smaller inefficiencies that repeatedly consume productive time across the fleet.
The most effective strategies typically include:
- Improving Dispatch Coordination: Better coordination between crews, hauling operations, and equipment allocation reduces standby time and keeps machines operating consistently throughout the shift.
- Reducing Idle-Heavy Operations: Telematics and operator coaching help fleets identify unnecessary idling that increases fuel burn, engine hours, and maintenance exposure without generating productive output.
- Aligning PM Schedules With Production Windows: Scheduling preventive maintenance around lower-demand operating periods reduces service-related interruptions during active production hours.
- Tracking Rework Sources: Monitoring recurring issues like overexcavation, failed compaction, and grading corrections helps reduce machine hours spent on nonproductive rework.
- Improving Equipment Visibility: Centralized asset visibility reduces time spent locating, transporting, and staging equipment between projects and operating areas.
- Standardizing Operational Workflows: Consistent operating procedures improve cycle efficiency, reduce avoidable delays, and create more predictable production output across crews.
Final Thoughts
Construction fleets rarely lose productivity because of a single major failure. Most losses come from smaller operational inefficiencies that compound across dispatching, downtime, idle time, rework, transportation delays, and inconsistent field coordination.
That is what makes TEEP valuable.
Instead of measuring equipment activity in isolation, TEEP helps contractors evaluate how effectively machines are contributing to actual project progress across total available time.
For many fleets, the biggest opportunity is not purchasing more equipment. It is improving the productivity, coordination, and operational visibility of the assets they already own.
As equipment costs continue rising across the construction industry, understanding that difference becomes increasingly important.
FAQs
Can TEEP help reduce equipment rental costs?
Yes. TEEP can reveal whether owned equipment is being underutilized before contractors rely on additional rentals. Many fleets discover they already have available capacity hidden behind scheduling gaps, standby time, or inefficient dispatching.
Why is TEEP harder to measure in construction than manufacturing?
Construction equipment operates in constantly changing environments where weather, terrain, crew coordination, and project conditions affect productivity daily. That variability makes standard benchmarking much more difficult than in fixed production facilities.
Does preventive maintenance improve TEEP?
Yes. Preventive maintenance improves equipment availability by reducing unexpected downtime, emergency repairs, and service interruptions during active production windows.
Can high utilization still indicate poor equipment performance?
Absolutely. An asset can appear highly utilized while spending large portions of the day idling, waiting for instructions, or operating inefficiently. High activity does not always mean high productivity.
Which departments benefit most from TEEP analysis?
TEEP creates operational visibility for fleet managers, maintenance teams, dispatch coordinators, project managers, and equipment supervisors because it connects productivity losses across multiple workflows.
Why do many fleets overestimate equipment productivity?
Many companies rely too heavily on engine hours or GPS movement without analyzing production quality, idle behavior, or actual output efficiency. This creates inflated utilization assumptions.
Can TEEP help with equipment replacement planning?
Yes. TEEP helps identify which assets consistently underperform operationally and which assets still deliver strong productive value, making replacement decisions more data-driven.
Is TEEP only useful for large construction fleets?
No. Small and mid-sized contractors can benefit from TEEP as well, especially when equipment ownership costs are high and maximizing productive machine hours becomes critical for profitability.
Transform Your Equipment Management