Construction Fleet Maintenance Checklist for Managers


Hi, I’m Maham Ali. I write about construction equipment management, helping teams use fleet data and maintenance intelligence to improve uptime, control costs, and run smoother jobsites.
Most fleets don't fail dramatically. They drift into failure as small issues stack up, inspections get rushed, and data sits in silos. Eventually, multiple assets go down on the same site, and maintenance suddenly becomes an emergency.
That's not bad luck. It's a system without control.
A construction fleet maintenance checklist isn't just a document for operators. It's a systematic approach that standardizes how information flows from the field to decision-makers. It reduces guesswork and ensures issues are resolved consistently.
Some teams try to manage this through spreadsheets, calls, and memory. Others consolidate inspections, preventive schedules, and asset health into systems like Clue, where every inspection feeds directly into maintenance workflows.
Let's take a closer look at what a construction fleet maintenance checklist should actually include.
What You're Actually Managing with a Construction Fleet Maintenance Checklist

You're not managing oil changes, filters, or grease intervals.
You're managing:
- Failure probability across assets
- Downtime risk across job sites
- Maintenance cost per hour vs revenue per hour
- Compliance exposure across regions
- Crew productivity tied to equipment availability
That changes how you design a fleet equipment maintenance checklist. Instead of "check everything," the goal becomes:
- Identify high-risk failure points early
- Standardize detection across operators
- Trigger action automatically
- Track outcomes at the management level
If a checklist doesn't influence those outcomes, it's decorative.
The Hidden Cost of Poor Maintenance Structure
Let's quantify the part nobody tracks properly.
- A minor hydraulic leak ignored for three days leads to hose failure.
- That hose failure results in equipment shutdown, followed by cleanup and repair.
- The downtime then spreads, causing crew idle time and project delays.
Now multiply that across 10 assets.
Industry estimates show downtime in heavy operations can reach tens of thousands per hour depending on the job context. That's not a maintenance problem. That's a revenue problem.
Preventive systems reduce emergency repairs by 30–40%, according to data. That's not optimization. That's survival at scale.
This is exactly what a structured maintenance checklist is designed to prevent.
Operator-Level Daily Equipment Checklist
This is your first line of defense. If this layer fails, everything else becomes reactive. The goal here is not detailed inspection. It's early detection with zero friction.
1. Fluids and Pressure Systems (Failure Indicators in Motion)
Operators should not just "check levels." They should observe behavior.
Core checks:
- Engine oil level and color consistency
- Coolant level and pressure stability
- Hydraulic fluid level and its response to pressure changes.
- Fuel system leaks or pressure drops
- Air pressure systems (for trucks and pneumatic tools)
Detailed signals to train operators on:
- Foaming in hydraulic oil indicates air contamination.
- Sudden oil darkening can indicate overheating, oxidation, soot, or contamination.
- Coolant loss without a visible leak suggests an internal engine issue.
- Pressure fluctuations during operation indicate system inefficiency.
Hydraulic system failures alone can halt entire workflows. One faulty excavator doesn't just stop digging. It disrupts hauling, loading, and downstream tasks.
2. Tires, Tracks, and Undercarriage
This is where money disappears quietly.
Checklist depth:
- Tire pressure measured, not estimated
- Tread depth compared across axles
- Sidewall damage or punctures
- Track alignment and tension
- Undercarriage wear patterns
Advanced indicators:
- Feathering wear indicates misalignment.
- Cupping suggests suspension issues.
- Excessive track slack leads to accelerated component wear.
Undercarriage costs can represent up to 50% of lifetime maintenance spend on tracked equipment. Ignoring daily inspection here is basically agreeing to higher costs.
3. Safety Systems
This isn't paperwork. This is liability control.
Checklist items:
- Brake response and stopping consistency
- Backup alarms and horns
- Lighting systems across all visibility points
- Operator restraints and seat belts
- Mirrors, cameras, and blind spot visibility
Equipment with safety defects should be removed from service immediately under OSHA-aligned practices. In reality, teams sometimes push it "just for today." That decision compounds risk.
4. Operational Behavior
Equipment rarely fails without warning. The signals are there, but they're often ignored.
Operators must log:
- Irregular engine RPM behavior
- Delayed hydraulic response
- Unusual vibrations or oscillations
- Persistent warning indicators
Advanced context:
- Vibration changes often indicate imbalance or internal wear
- Delayed hydraulics can signal pressure loss or valve issues
- Engine hesitation may indicate fuel delivery problems
This is where human observation outperforms sensors, when it is captured properly.
5. Attachments and Structural Integrity
Inspection points:
- Attachment wear (bucket edges, forks, etc.)
- Pin locking mechanisms
- Weld integrity and micro-cracks
- Loose fasteners
Structural fatigue develops over time. Daily inspection doesn't just prevent failure, it prevents catastrophic failure.
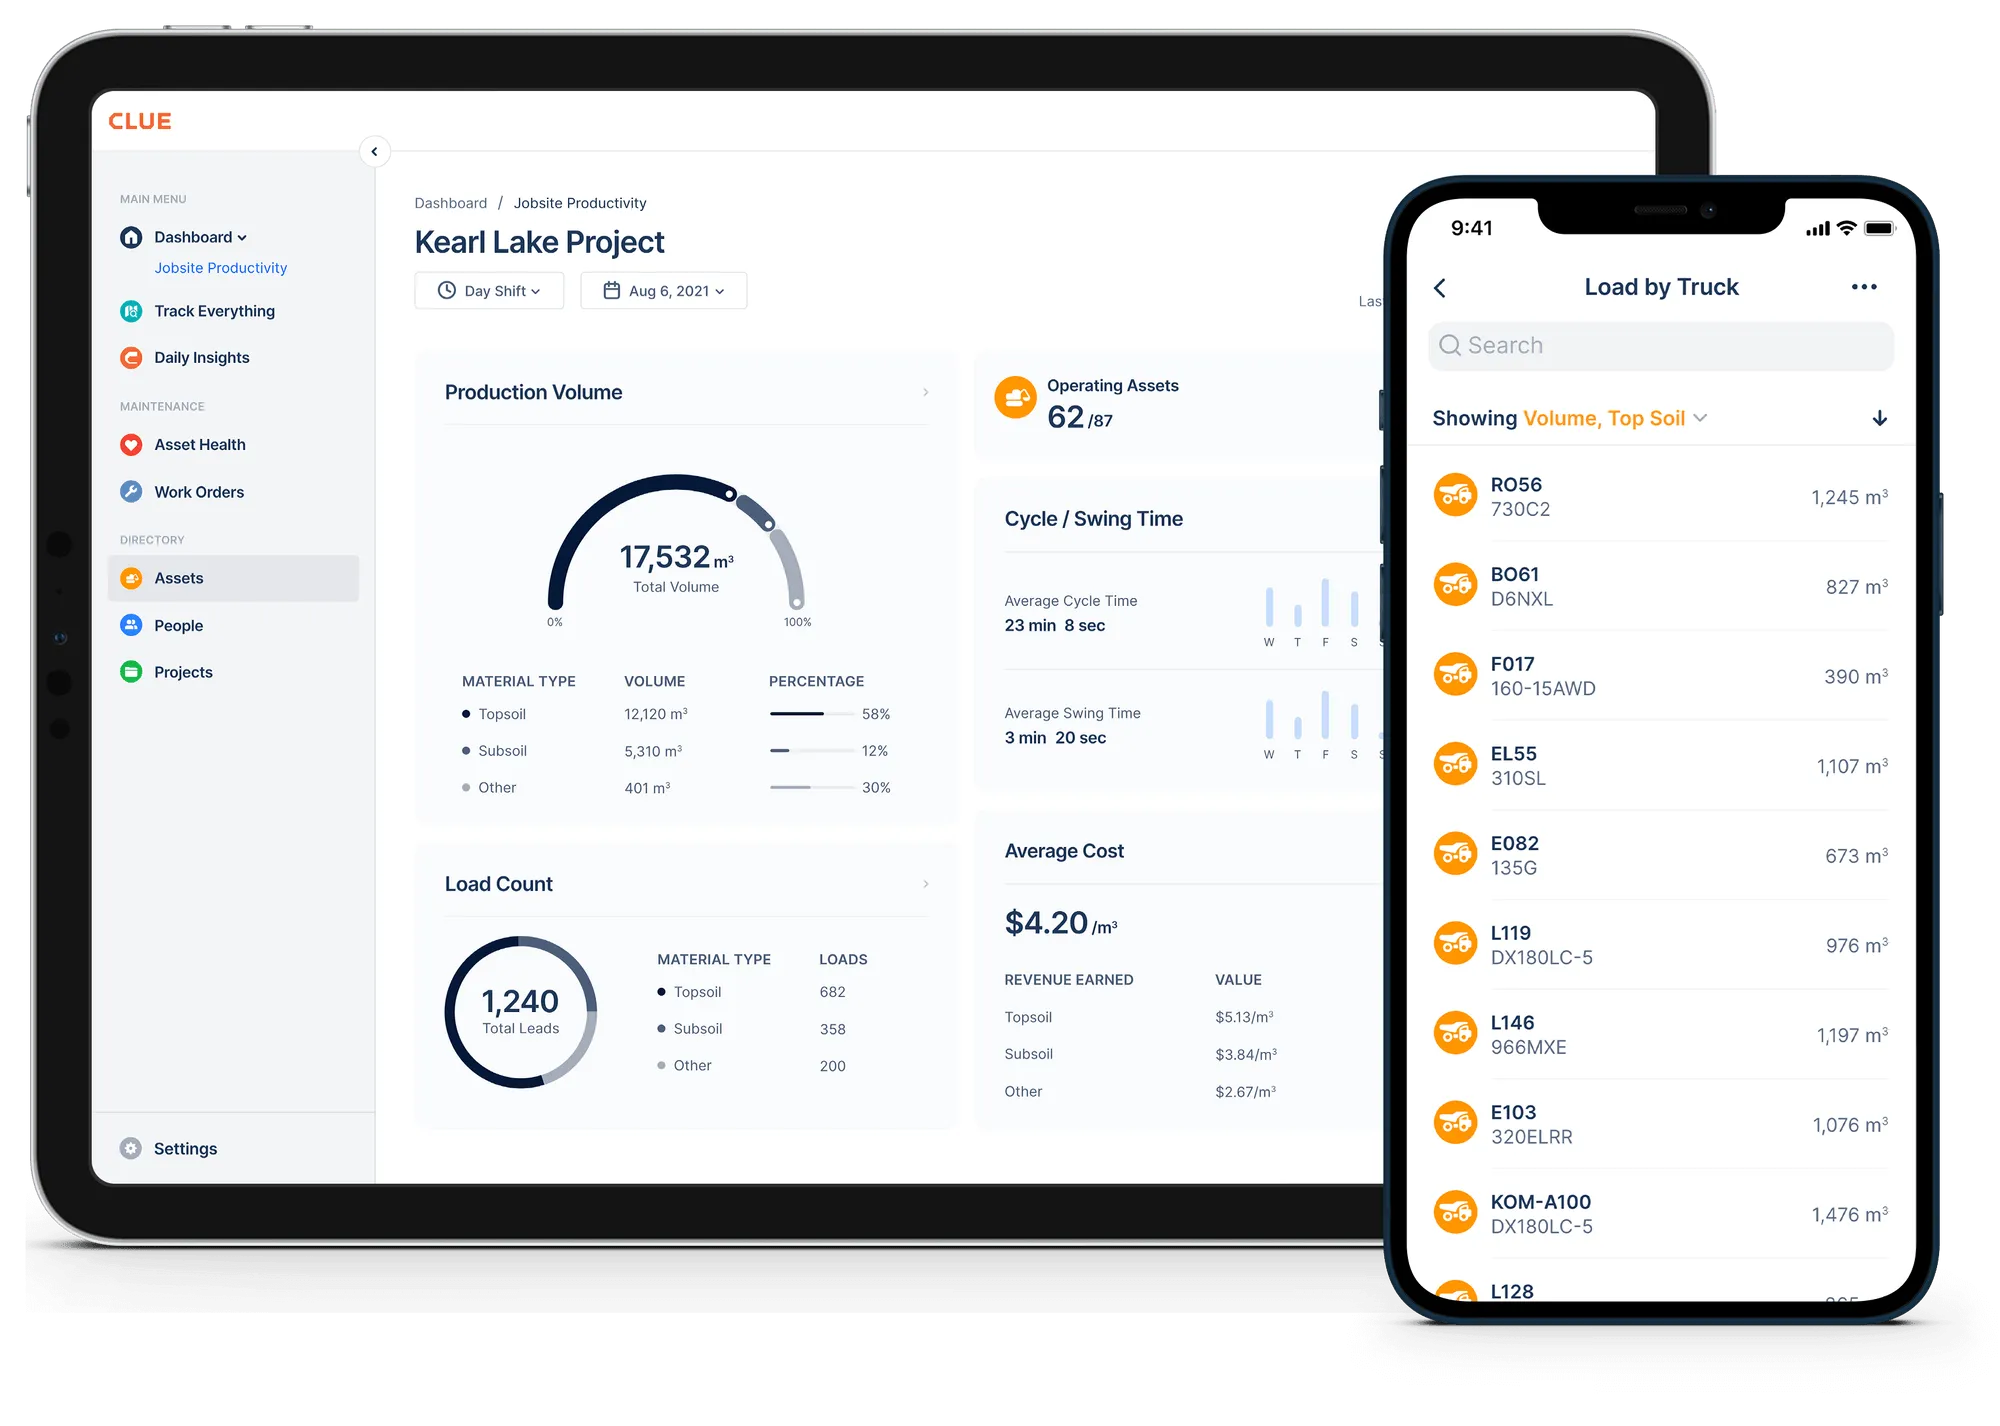
What a High-Compliance Daily Checklist Looks Like
.webp)
A real construction fleet maintenance checklist at this level should:
- Be completed in under 180 seconds
- Use binary inputs (pass/fail)
- Require comments for failed items
- Capture photo evidence when needed
- Trigger maintenance requests automatically
Overcomplicating the process reduces compliance, while a lack of structure undermines reliability.
Weekly Maintenance Checklist for Managers
Daily checks identify issues, while weekly checks slow down deterioration. This is where your fleet preventive maintenance checklist starts extending asset life.
1. Lubrication Systems
Tasks:
- Grease all pivot points
- Inspect lubrication pathways
- Identify dry or over-lubricated areas
Advanced insight:
- Over-lubrication attracts contaminants
- Under-lubrication increases friction exponentially
- Incorrect grease type reduces effectiveness
Proper lubrication alone can significantly extend component life, especially in high-load environments.
2. Electrical Systems
Checklist depth:
- Battery voltage under load
- Terminal corrosion levels
- Wiring harness integrity
- Alternator output
Electrical issues rarely fail immediately. They degrade. Then fail at the worst possible time.
3. Filtration Systems
Inspection points:
- Engine air filters (restriction levels)
- Cabin filters
- Early-stage fuel filter clogging
Operational impact:
- Reduced airflow increases fuel consumption
- Contaminated fuel systems damage injectors
- Poor filtration reduces engine efficiency
4. Hoses, Belts, and Flexible Components
Checklist items:
- Surface cracking
- Bulging or soft spots
- Belt tension and alignment
- Heat damage
Advanced detail:
- Rubber degradation accelerates under heat cycles
- Minor cracks often precede full failure by days or weeks
- Weekly inspection prevents emergency replacements.
Monthly Maintenance Checklist for Managers
By the time you reach monthly maintenance, you're no longer trying to "keep things running." That's already handled by daily and weekly checks.
This layer is about controlling performance, preventing hidden degradation, and extending asset life. It's where managers move from reacting to issues, to actively shaping how equipment performs over time.
Think of monthly maintenance as your performance audit cycle. You're validating whether your fleet is operating efficiently or slowly drifting toward higher costs and lower reliability.
1. Oil Management and Analysis
Oil is one of the most reliable indicators of internal component condition. It reflects wear, contamination, and system efficiency in a way that visual inspections cannot.
Core Tasks
- Replace engine oil based on operating hours rather than fixed calendar intervals
- Replace oil filters to maintain proper flow and filtration efficiency
- Conduct oil sampling and laboratory analysis where feasible
What Oil Analysis Reveals
A structured oil analysis program provides insight into:
- Metal particles (iron, copper, aluminum): Indicates internal wear in components such as bearings, pistons, or gears
- Fuel dilution: Suggests inefficiencies in combustion or injector performance
- Coolant contamination: Points to potential internal leaks or gasket issues
- Viscosity breakdown: Signals that oil is no longer providing adequate protection under load
2. Cooling System Efficiency
Cooling systems play a critical role in maintaining engine stability. Their degradation is gradual and often goes unnoticed until it leads to overheating.
Core Checklist Tasks
- Clean radiators to remove dust and debris restricting airflow
- Test coolant levels and chemical composition
- Inspect hoses, clamps, and seals for leaks or wear
- Evaluate fan performance, including belt-driven and electric systems
Key Indicators to Monitor
- Reduced airflow due to clogged radiator fins
- Incorrect coolant ratios affecting heat transfer
- Minor leaks that are not visible during daily checks
- Inconsistent fan performance under load
3. Powertrain Systems
The powertrain directly influences how effectively equipment converts fuel into productive work. Even small inefficiencies can increase operational costs over time.
Inspection Scope
- Transmission performance and shift consistency
- Drive shaft alignment and balance
- Universal joint (U-joint) condition
- Differential performance and noise levels
Early Warning Signs
- Delayed or rough gear shifts
- Vibrations at specific speeds or loads
- Increased fuel consumption without clear cause
- Low-level noise during operation
4. Brake System Health
Brake systems require consistent monitoring, not only for safety but also for cost management and regulatory compliance.
Core Tasks
- Measure brake pad and disc wear against manufacturer specifications
- Assess brake fluid condition and check for contamination
- Inspect brake lines for leaks, cracks, or pressure inconsistencies
- Evaluate braking performance under load conditions
Commonly Overlooked Issues
- Gradual reduction in braking efficiency
- Moisture contamination in brake fluid
- Uneven wear across wheels or axles
What This System Delivers (When It Actually Works)

A structured fleet maintenance checklist system gives you:
- Predictable Equipment Availability: Asset status is clear at all times, so you know what's ready, what needs service, and what's at risk before it affects the job.
- Lower Maintenance Cost per Hour: Failures are contained before they disrupt operations.
- Reduced Emergency Repairs: Issues are handled before they escalate into operational disruptions.
- Better Technician Utilization: Work is planned and structured, minimizing interruptions and improving execution efficiency.
- Clear Accountability Across Teams: Every action is tracked, making delays and missed steps visible and easier to correct.
This is not about doing more maintenance. It's about removing uncertainty from operations.
KPI Framework That Actually Drives Maintenance Decisions
Tracking metrics just to "have a dashboard" is useless. KPIs exist to force decisions before failures happen. You don't need more metrics, you need the right ones, clearly defined and consistently reviewed.
1. Uptime Ratio
Percentage of time equipment is operational vs available. Everything else feeds into this. If uptime drops, something in your system is failing.
Target benchmarks:
- 90–95% → acceptable
- 95–98% → strong control
- 98%+ → highly optimized operation
2. Planned vs Reactive Maintenance Ratio
Percentage of scheduled maintenance vs emergency repairs. At least 70–80% planned maintenance. If your team is constantly firefighting, this number drops fast.
Operational impact:
- Higher planned ratio → predictable costs
- Higher reactive ratio → expensive repairs + downtime
This is one of the clearest indicators of whether your fleet preventive maintenance checklist is actually working.
3. Mean Time Between Failures (MTBF)
It is the average operating time before a breakdown occurs. It measures reliability, not just maintenance activity.
How to use it:
- Track per asset type (excavators vs trucks behave differently)
- Monitor trends, not just values
- Declining MTBF = early warning signal
4. Mean Time to Repair (MTTR)
It is the average time required to fix an issue once it occurs. As low as operationally possible (often under 4-6 hours for critical assets). A good system doesn't just prevent failures. It fixes them fast when they happen.
What affects it:
- Parts availability
- Technician skill
- Work order clarity
- Diagnostic speed
5. Maintenance Cost per Operating Hour
It is the total maintenance spend divided by equipment operating hours. This is where financial visibility shows up.
Breakdown includes:
- Labor
- Parts
- External services
- Downtime-related cost (if tracked properly)
6. Service Compliance Rate
It is calculated as the percentage of scheduled maintenance completed on time.
Target:
- 95-100%
Most fleets think they're compliant. The data usually says otherwise. Missed service intervals directly reduce asset lifespan. Quietly.
How Technology Turns Maintenance into a Controlled System
At this stage, the checklist is not the problem. Execution is.
As operations scale, coordination becomes manual and starts to break down. Technology closes that gap by connecting detection, decision, and execution into one flow.
1. Enforcing Execution from Field to Maintenance
In smaller operations, issues can be tracked manually. At scale, that breaks.
A connected system like Clue ensures that inspections don't stop at reporting. Every input from the field moves directly into a structured workflow, where issues are logged, prioritized, and assigned without relying on manual follow-up.
This keeps execution consistent, regardless of who reports the issue or where it originates.
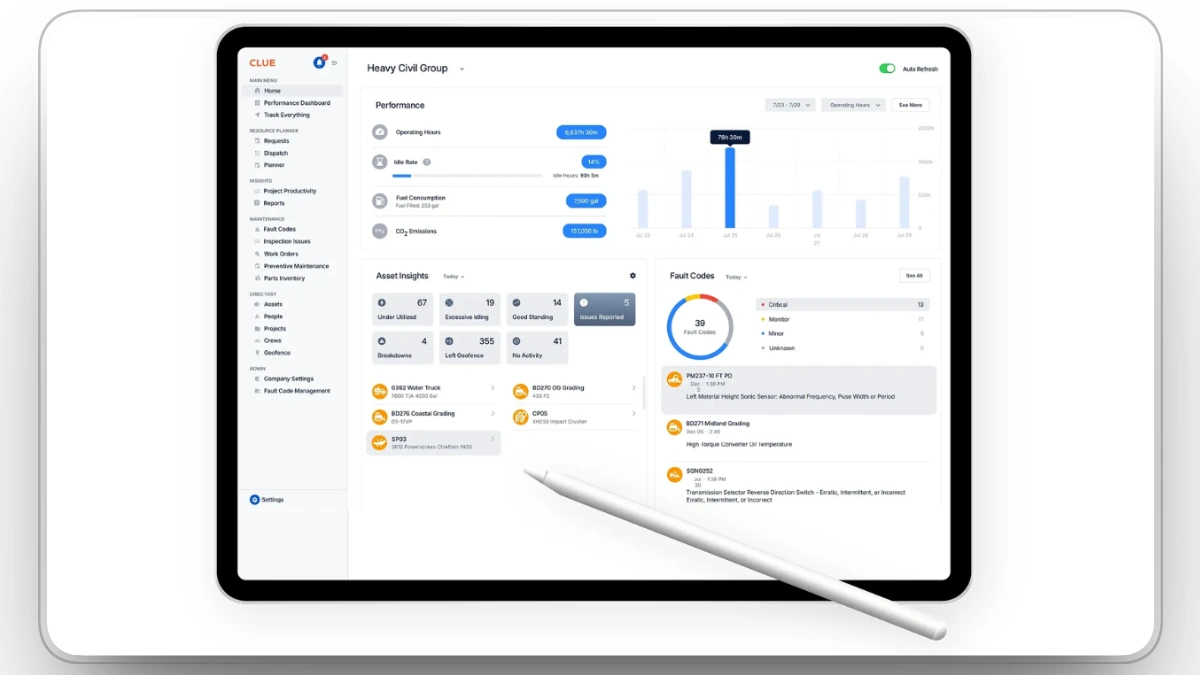
2. Maintaining Real-Time Operational Visibility
As fleets expand across multiple sites, visibility becomes fragmented. Updates are delayed, and decisions rely on incomplete information.
Technology centralizes asset status, maintenance activity, and open issues into a single pane of glass. Managers no longer depend on updates from different teams. They operate with a consistent, real-time understanding of fleet condition across all locations.
3. Scaling Maintenance with Usage-Based Logic
Static schedules don't scale across diverse equipment usage. Technology enforces maintenance based on actual utilization, ensuring that service timing remains accurate across all assets. High-use equipment is serviced more frequently, while low-use assets are not over-maintained.
This keeps equipment maintenance aligned with real operating conditions without manual adjustment.
4. Standardizing Execution Across Sites
Different teams introduce variation. Variation reduces reliability. Technology enforces standardized inspection workflows and data capture across all sites. Every inspection follows the same structure, every issue is logged consistently, and every action is tracked in the same way.
This removes inconsistency and makes fleet-wide data reliable.
5. Converting Data into Operational Control
At scale, data only matters if it drives decisions. Technology consolidates inspection, maintenance, and asset data into a system where trends are visible and actionable. Managers can identify recurring issues, track performance across assets, and make decisions based on actual patterns rather than assumptions.
Clue allows for flexible inspections through digital tools like WhatsApp or SMS, improving compliance without the need for a dedicated app.
Best Practices for Building an Accurate Construction Fleet Maintenance Checklist
The objective is simple: ensure every inspection contributes directly to uptime, safety, and cost control.
- Align checklists to asset behavior, not categories: Inspection points should reflect how each asset actually fails under load, not just what it is. Relevance drives accuracy.
- Design for speed at the field level: Inspections must be fast, binary, and repeatable. Simplicity improves completion rates and reduces variation across operators.
- Convert inputs into execution: Every failed check should immediately define the next step, with clear ownership and priority. No ambiguity in what happens next.
- Anchor schedules to real usage: Maintenance should follow engine hours, mileage, and workload intensity. This keeps servicing aligned with actual wear.
- Enforce uniform structure across operations: A consistent inspection framework ensures data is comparable across sites and teams, enabling reliable oversight.
- Continuously recalibrate using performance data: Checklists should evolve based on failure patterns, not remain fixed. Accuracy improves with feedback loops.
Challenges in Creating an Accurate Construction Fleet Maintenance Checklist

The difficulty is not designing the checklist. It's maintaining accuracy across changing conditions, assets, and teams.
- Generic frameworks dilute effectiveness: Broad checklists fail to capture asset-specific risks, leading to missed issues and reduced inspection value.
- Execution drops under field pressure: Time constraints and unclear inputs lead to skipped steps and inconsistent reporting, weakening data quality.
- Issues stall after identification: Problems are recorded but not acted on quickly enough, allowing minor faults to escalate into operational disruptions.
- Data fragmentation limits visibility: When inspection, maintenance, and asset data are disconnected, patterns remain hidden and decisions slow down.
- Variation across teams reduces reliability: Different interpretations of the same checklist create uneven standards and inconsistent outputs.
- Static checklists lose relevance over time: As usage patterns and conditions evolve, outdated inspection criteria fail to capture emerging risks.
Conclusion
A well-structured fleet maintenance checklist aligns inspections, maintenance, and decision-making into a seamless flow. Issues are identified early, acted on swiftly, and tracked consistently. Equipment availability becomes predictable, costs stabilize, and operations run smoothly.
Without structure, data is collected but not used, and problems remain unresolved.
As operations scale, manual control becomes unsustainable. Clue consolidates inspections, workflows, and asset health into one system, ensuring nothing falls through the cracks.
It's not about doing more maintenance; it's about managing failures proactively before they disrupt operations.
FAQs
1. How do maintenance checklists adapt to variable labor skill levels across crews?
Maintenance tasks need to be tiered. Level 1 checks require basic visual inspections and simple validation such as fluids and lights. Level 2 tasks, which require intermediate skills, include filter changes and tension adjustments. Level 3 tasks are for certified technicians. A good system automates tier assignments based on historical error rates and crew qualifications.
2. Can a maintenance checklist engine dynamically change based on usage patterns?
Yes, an advanced system should adjust checklist logic based on usage. For instance, it could shorten intervals for assets with high idle hours and add extra checks if telematics fault codes appear more frequently. This conditional logic helps prevent checklist fatigue while focusing on actual risk factors.
3. How should the checklist handle intermittent faults that don't show consistently on telematics?
The system should create pattern-based triggers. If a fault code appears a certain number of times within a defined period, a special inspection module should be inserted into the checklist. This module would include targeted checks, such as verifying wiring harness integrity, which wouldn't be part of standard checks.
4. What's the role of contextual checks based on the environment?
Assets working in environments like dusty sites, rocky terrain, or extreme temperatures require additional contextual checks. For example, a dusty site may require more frequent air filter inspections, or extreme conditions may necessitate vibration sensor checks. A forward-thinking system should auto-inject these items when environmental metadata is tagged to the jobsite.
5. How is priority assigned when multiple issues are detected during a single checklist run?
Priority is determined by risk scoring, which combines safety risk, asset value, and project criticality. Issues are automatically tagged as Urgent, High, or Deferred. The system enforces hard stops for critical failures, preventing the asset from being released until the issue is resolved.
6. How should maintenance checklist data be correlated to production metrics?
A next-level checklist system should correlate maintenance data with production metrics like daily output units, cycle times, and utilization ratios. This allows managers to quantify the impact of maintenance on production cadence, improving efficiency and planning.
7. How do maintenance checklists support regulatory compliance?
Properly designed checklists capture safety inspections that meet OSHA or local regulatory standards. They also provide an auditable record of accident history and service history, ensuring adherence to OEM service intervals and protecting warranty coverage.
8. Can a maintenance checklist reduce operating costs?
Absolutely. Catching issues early and standardizing inspections reduces the need for major repairs, minimizes fuel waste from poorly maintained assets, and cuts idle time caused by unexpected breakdowns. This results in lower maintenance costs and better overall fleet performance.
Transform Your Equipment Management