What is this?
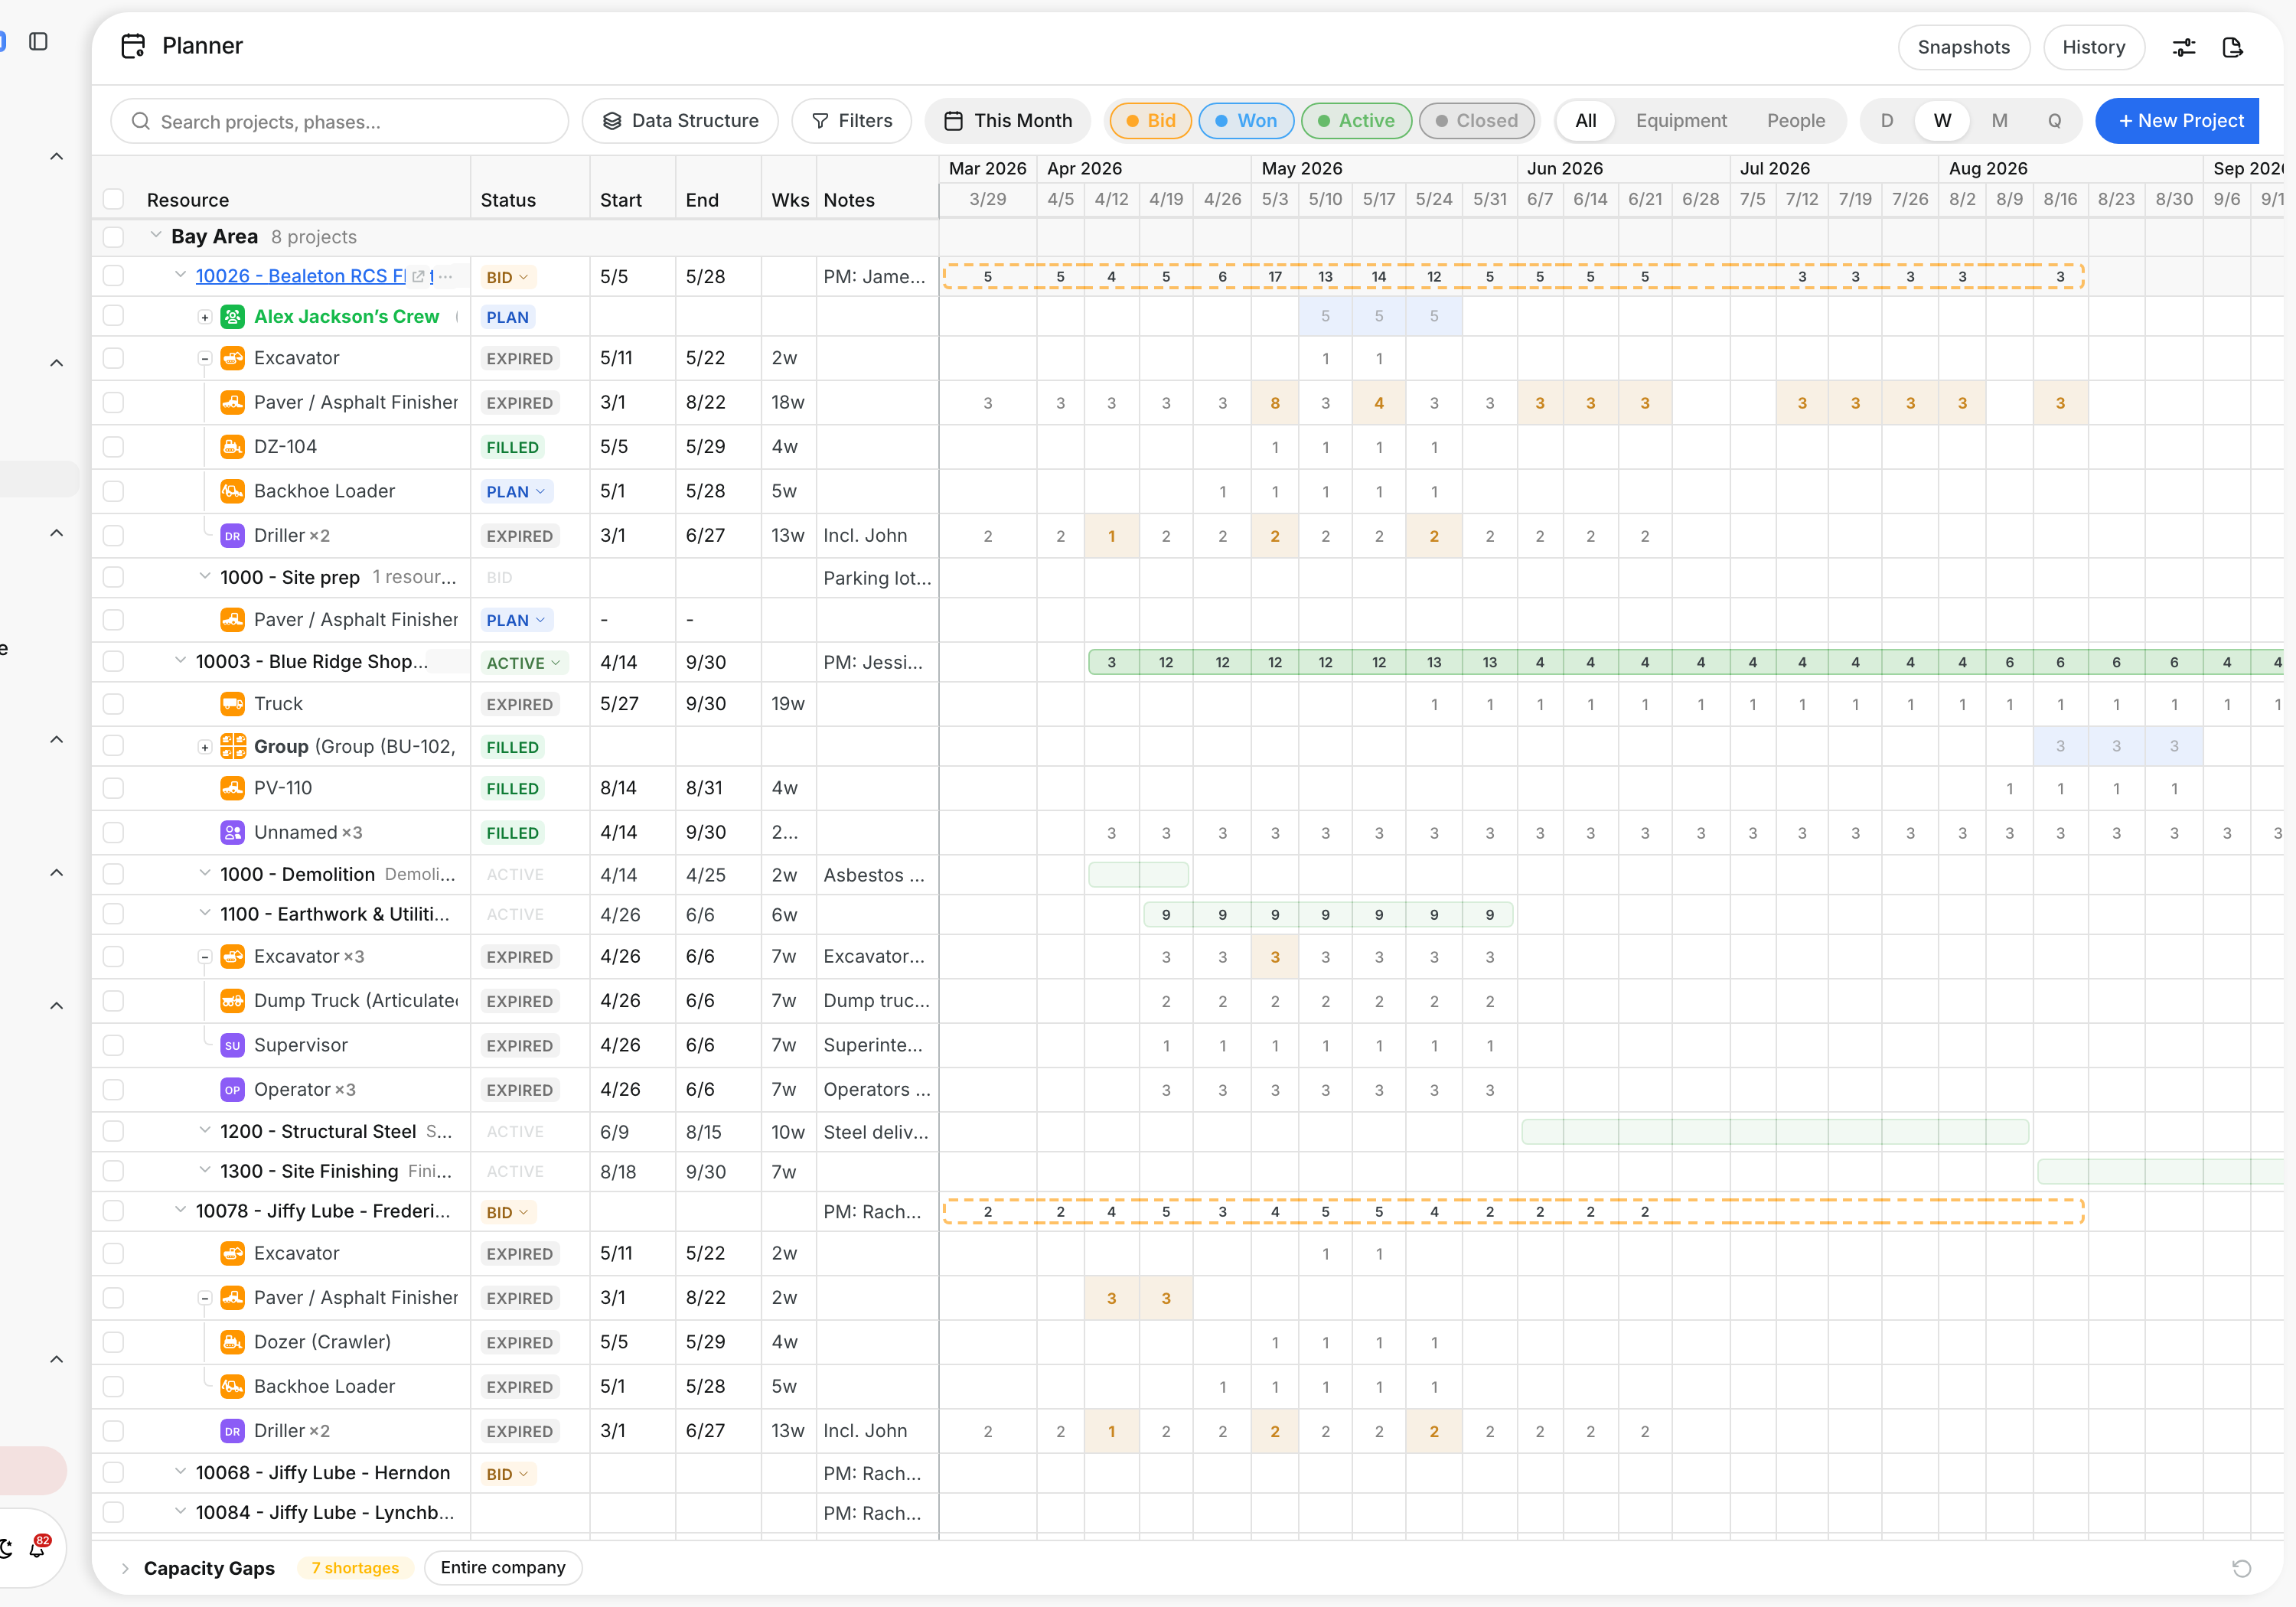
The Planner shows all your projects on one timeline. Rows are grouped by division, then project, phase and resource. A resource is a request for equipment or people, such as two excavators for six weeks.
The numbers in the grid show how many units each request needs in each week. You see the whole plan at once, and you can change it in place.
Who's this for?
- Project managers, plan the equipment and crews each phase needs.
- Equipment managers and dispatchers, see what every job needs next week and fill it.
- Operations managers, compare the demand across all jobs and divisions.
How to use it
Step 1: Open the Planner
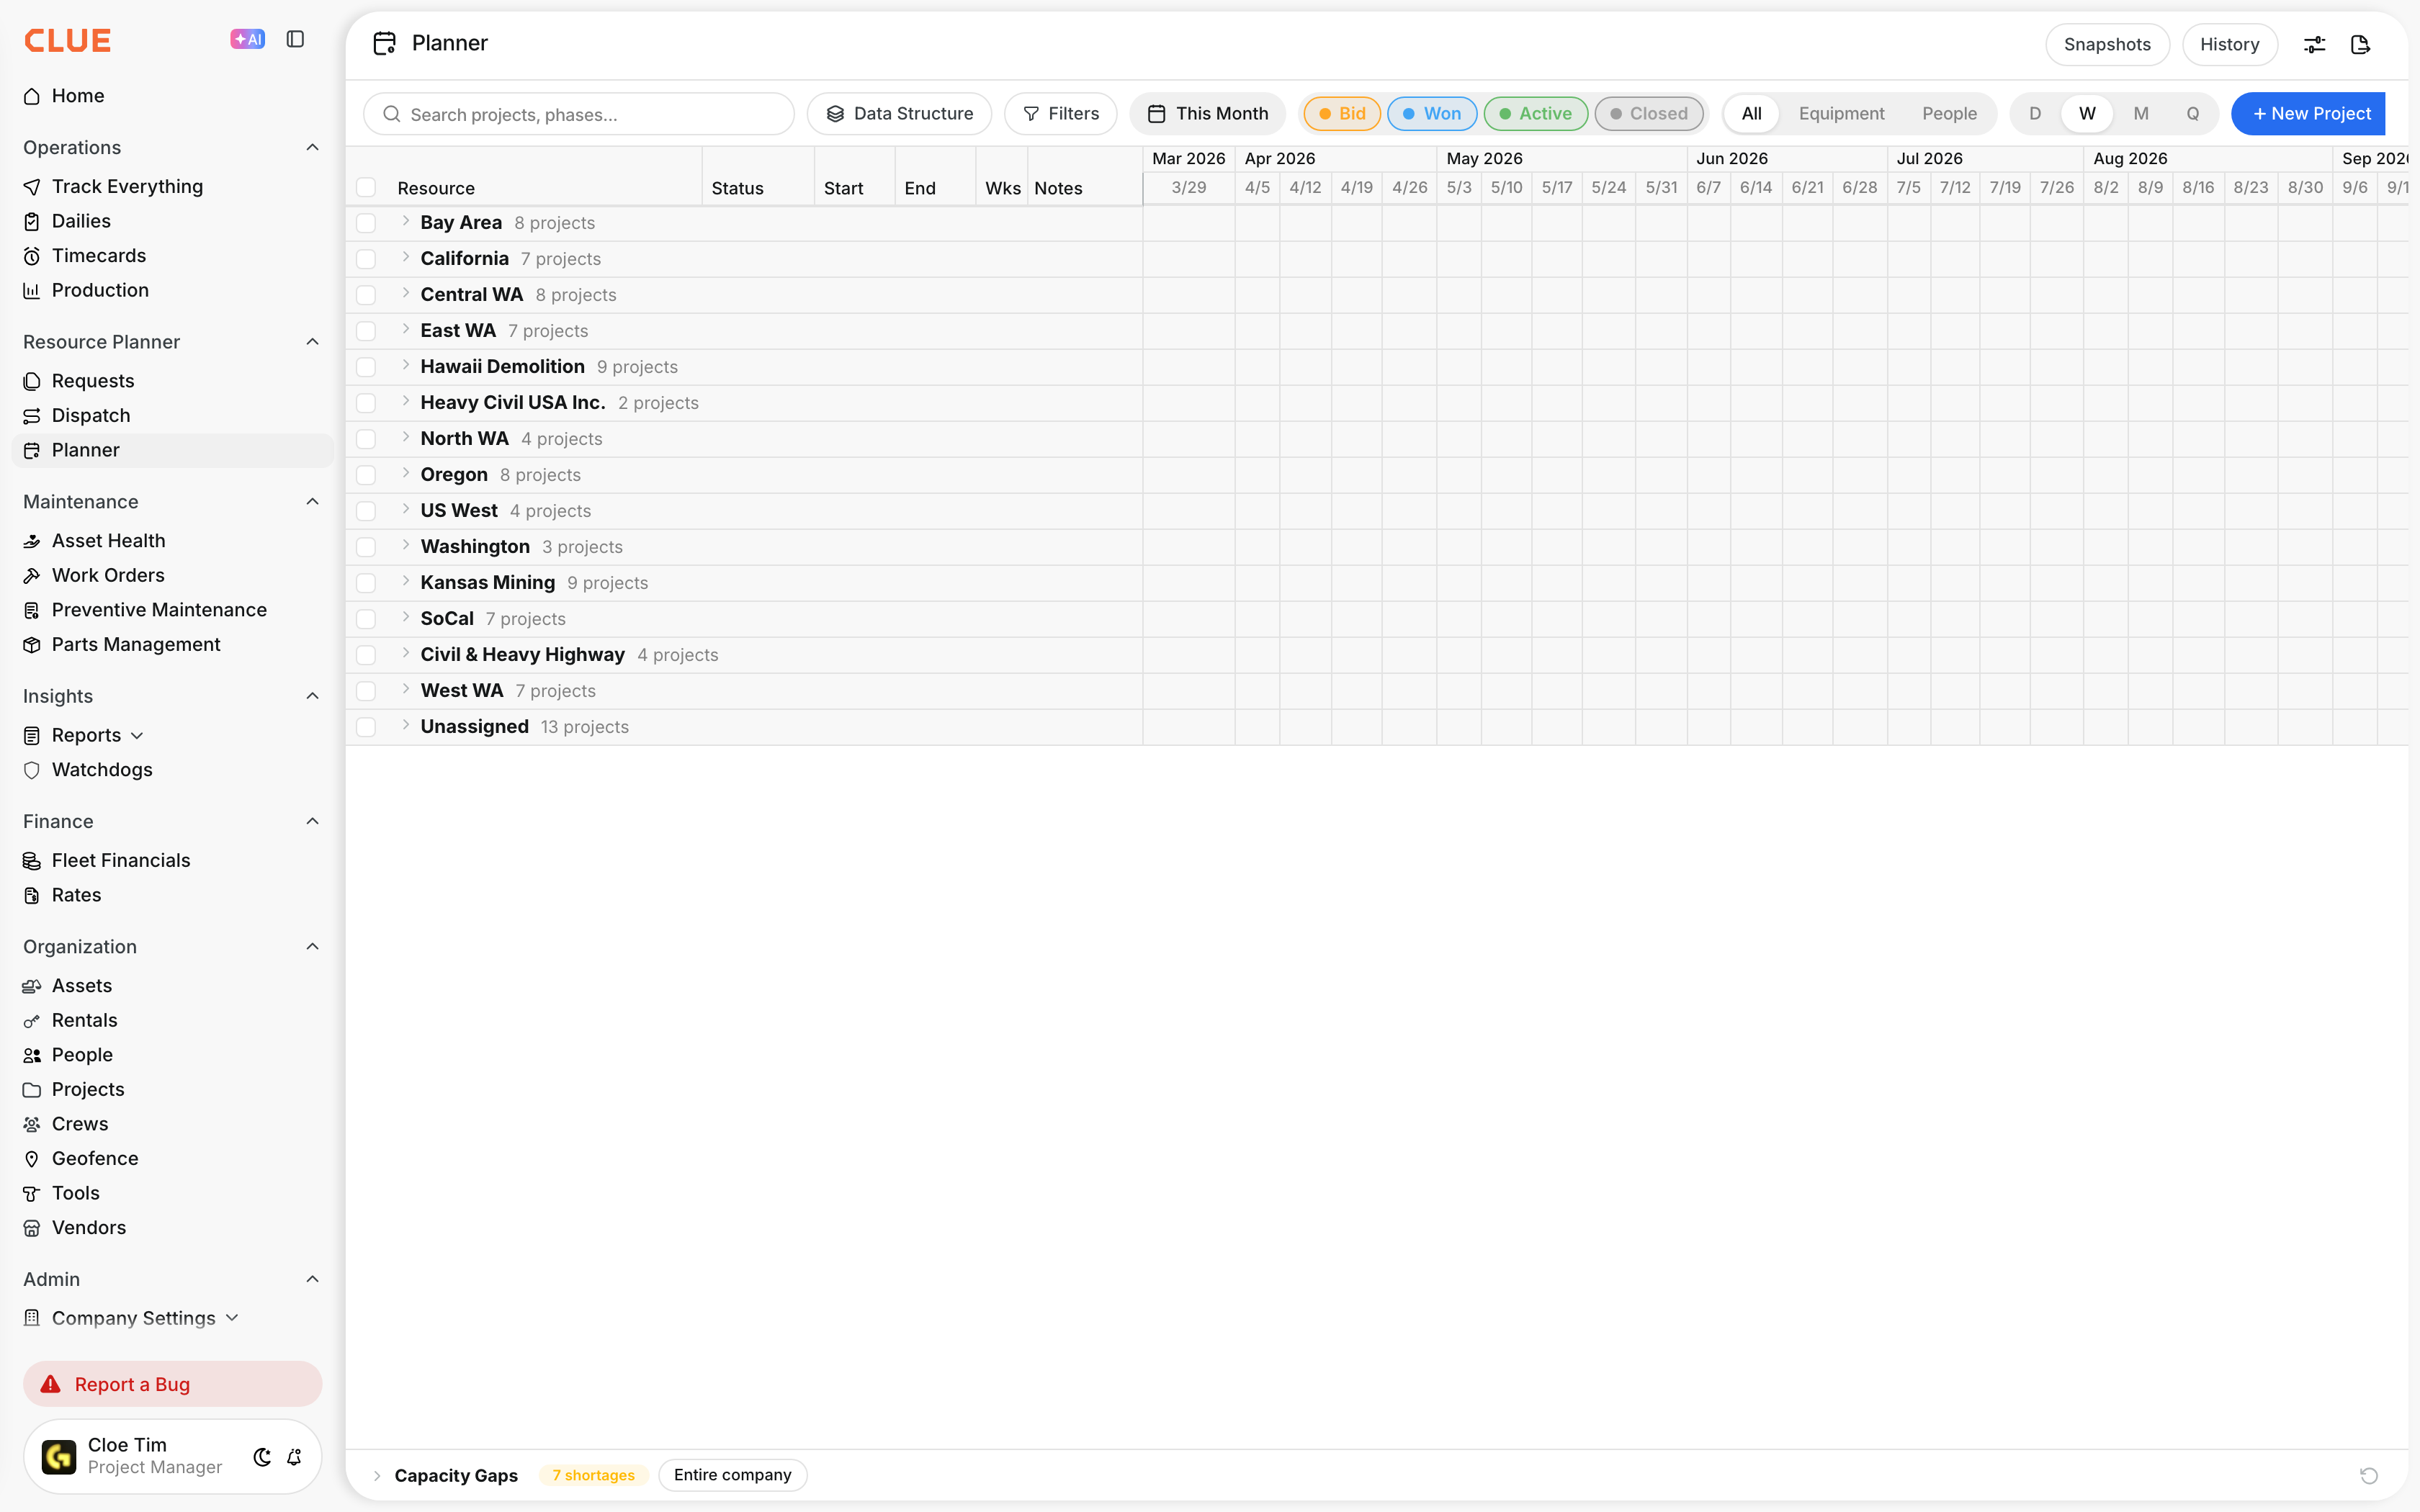
Go to Resource Planner > Planner. Each row starts as a division with its number of projects.
Step 2: Expand the rows
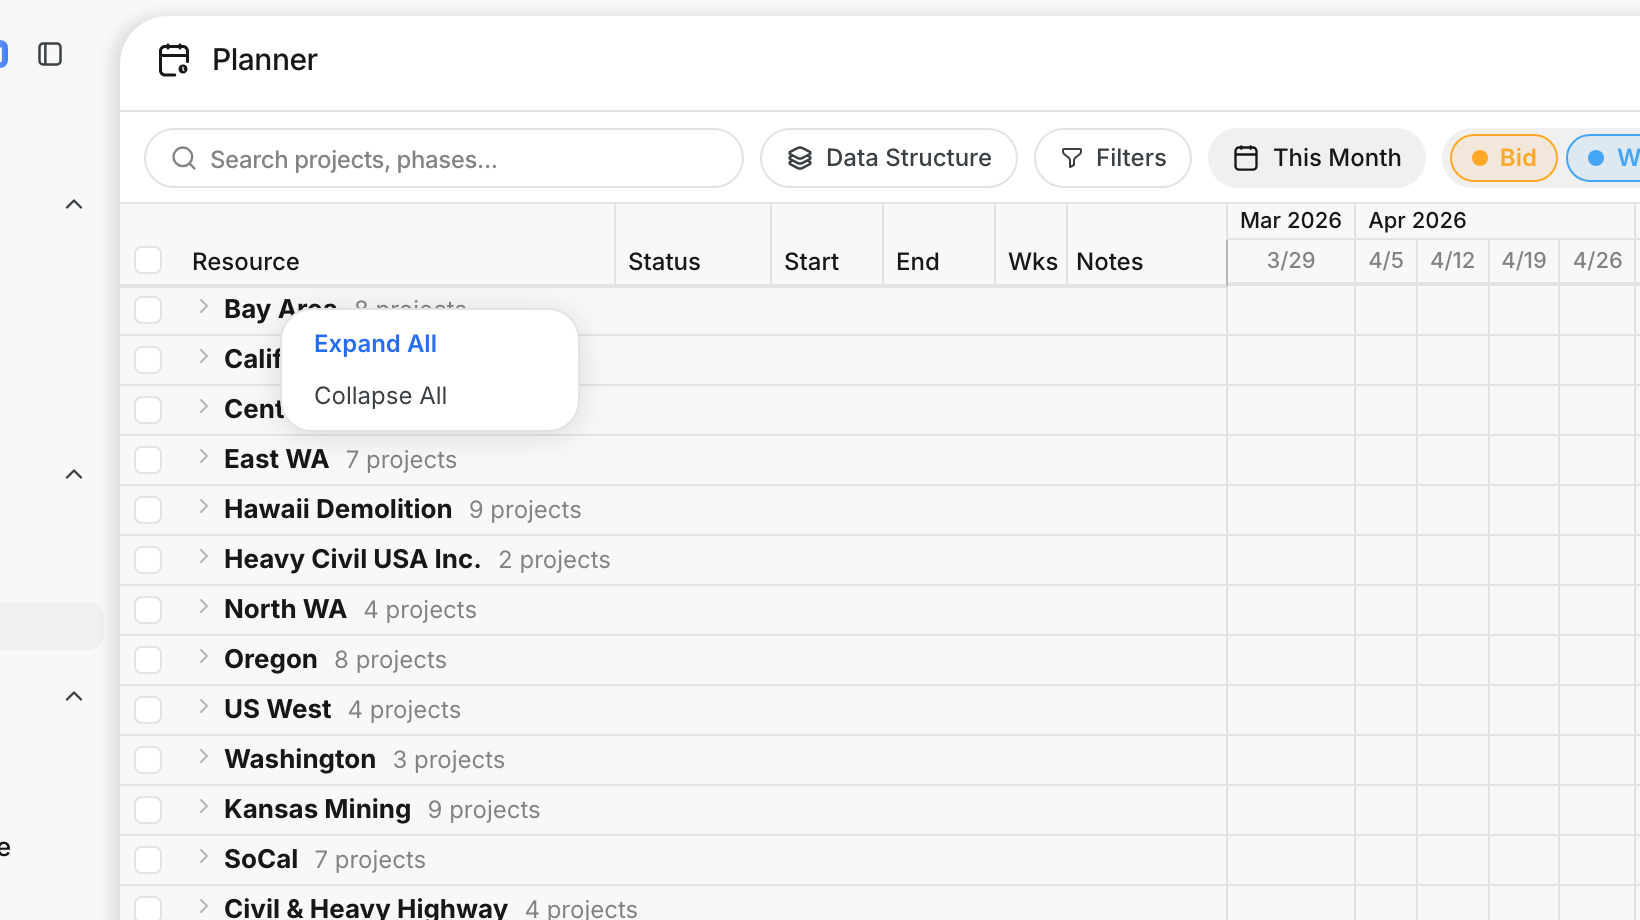
Click a division to open it. Click a project or phase to open the next level. To open everything at once, right-click a division, project or phase row and click Expand All. Collapse All closes everything.
Step 3: Read the grid
Each resource row shows its Status, Start, End, number of weeks and notes. The numbers to the right are the quantity needed in each column.
- Project bar: the color comes from the project stage. A dashed outline means the project is a bid.
- Amber number: the quantity was changed for that week only.
- Status badges: Plan, Open, Filled, Partial, Cancelled and Expired.
- "(requested)" row: a unit that is still waiting for an asset or person.

Step 4: Pick the dates and zoom
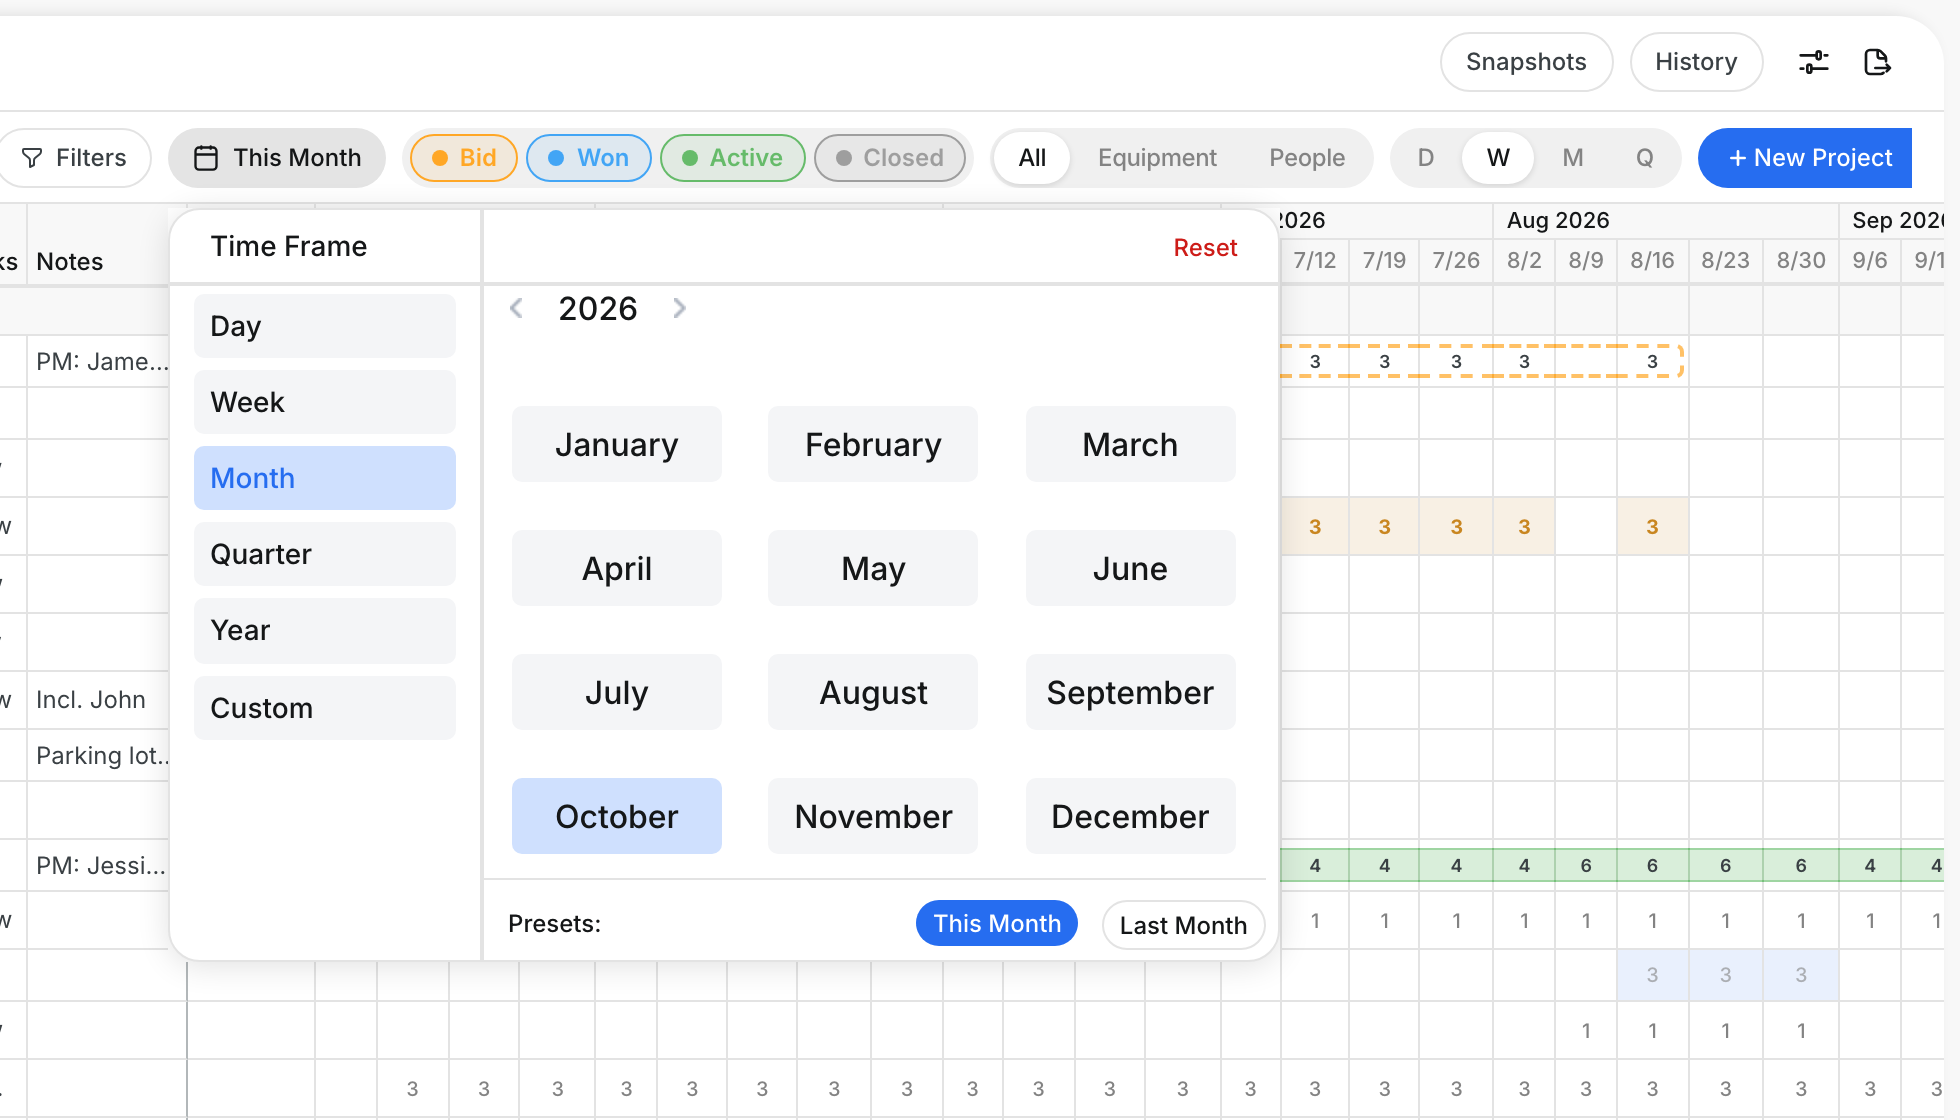
Click the date button, for example This Month. Choose Day, Week, Month, Quarter or Custom, and pick the period. The D, W, M and Q buttons change the width of each column to a day, week, month or quarter.
Step 5: Narrow what you see
Use the bar at the top of the page:
- Search finds projects and phases by name.
- Status chips, such as Bid, Won, Active and Closed, show or hide projects in each stage. Click a chip to switch it on or off.
- All, Equipment, People shows all resources, or one type only.
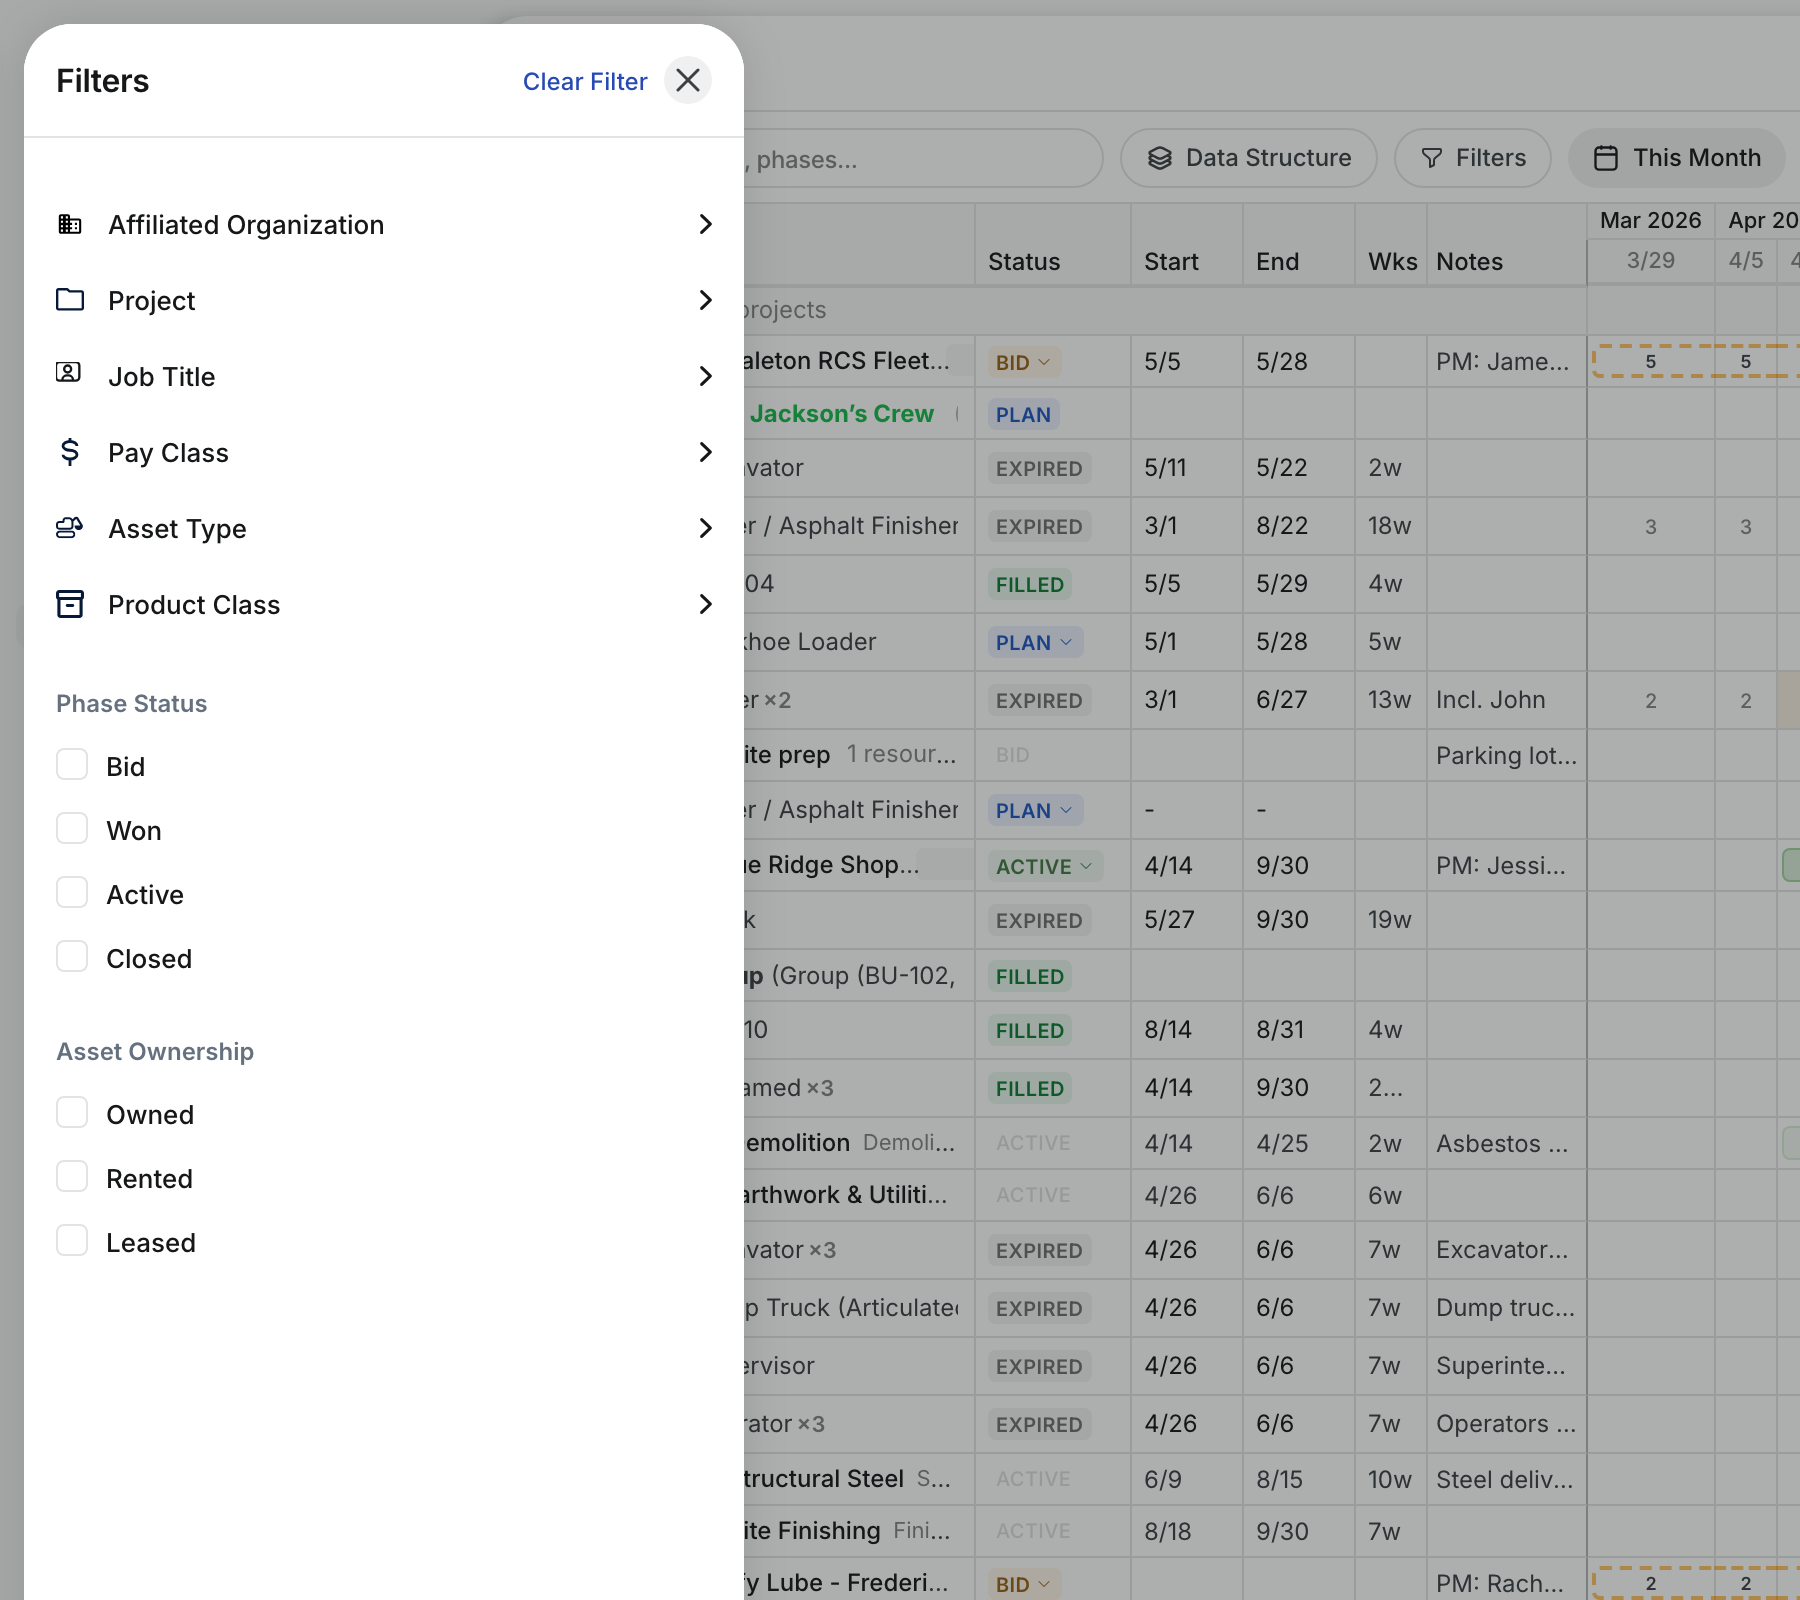
- Filters opens more choices: organization, project, job title, pay class, asset type, product class, phase status and asset ownership. The filters apply when you close the panel.
Step 6: Change the grouping
Click Data Structure. Tick the levels you want, such as your divisions and Project, and drag them into the order you want. Click Save. To group by Resource Category, Resource Type or Product Class, drag that level above the division and project levels first.
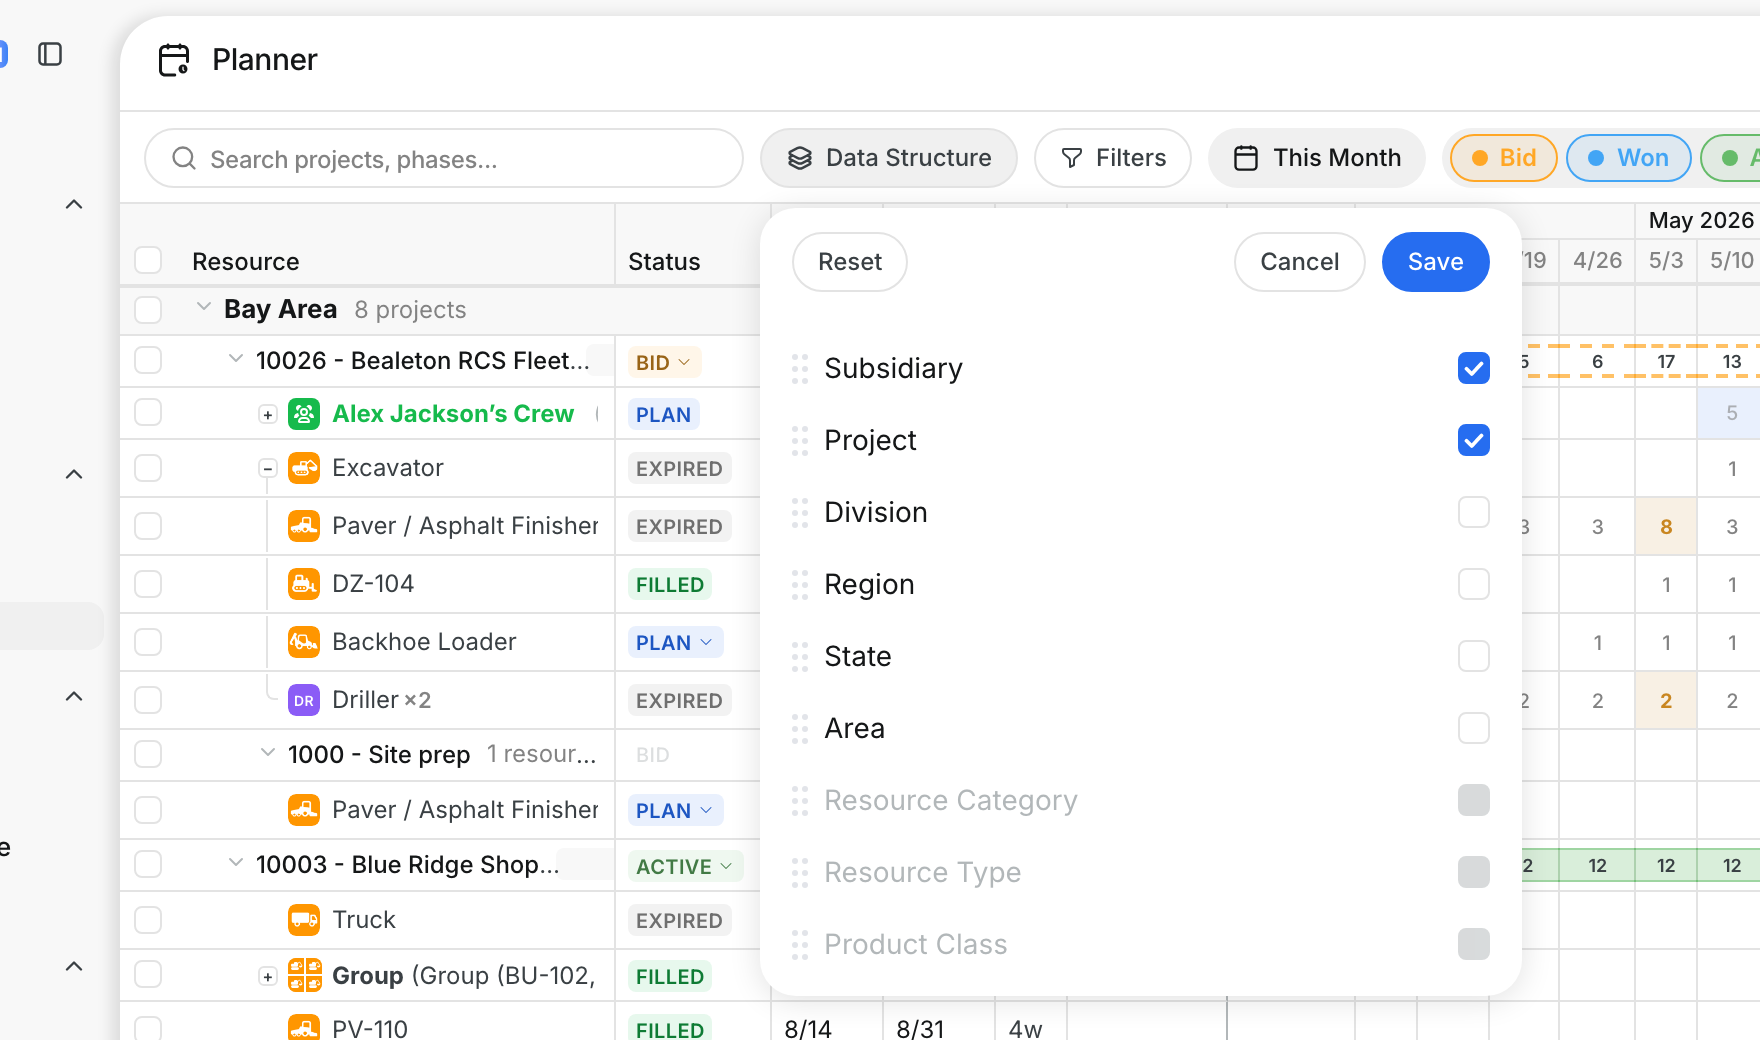
Step 7: Show or hide columns
Click the Table Settings icon at the top right. Switch Wks, Notes or Last 7 Days Utilization % on or off, then click Save. Resource, Status, Start and End always show.
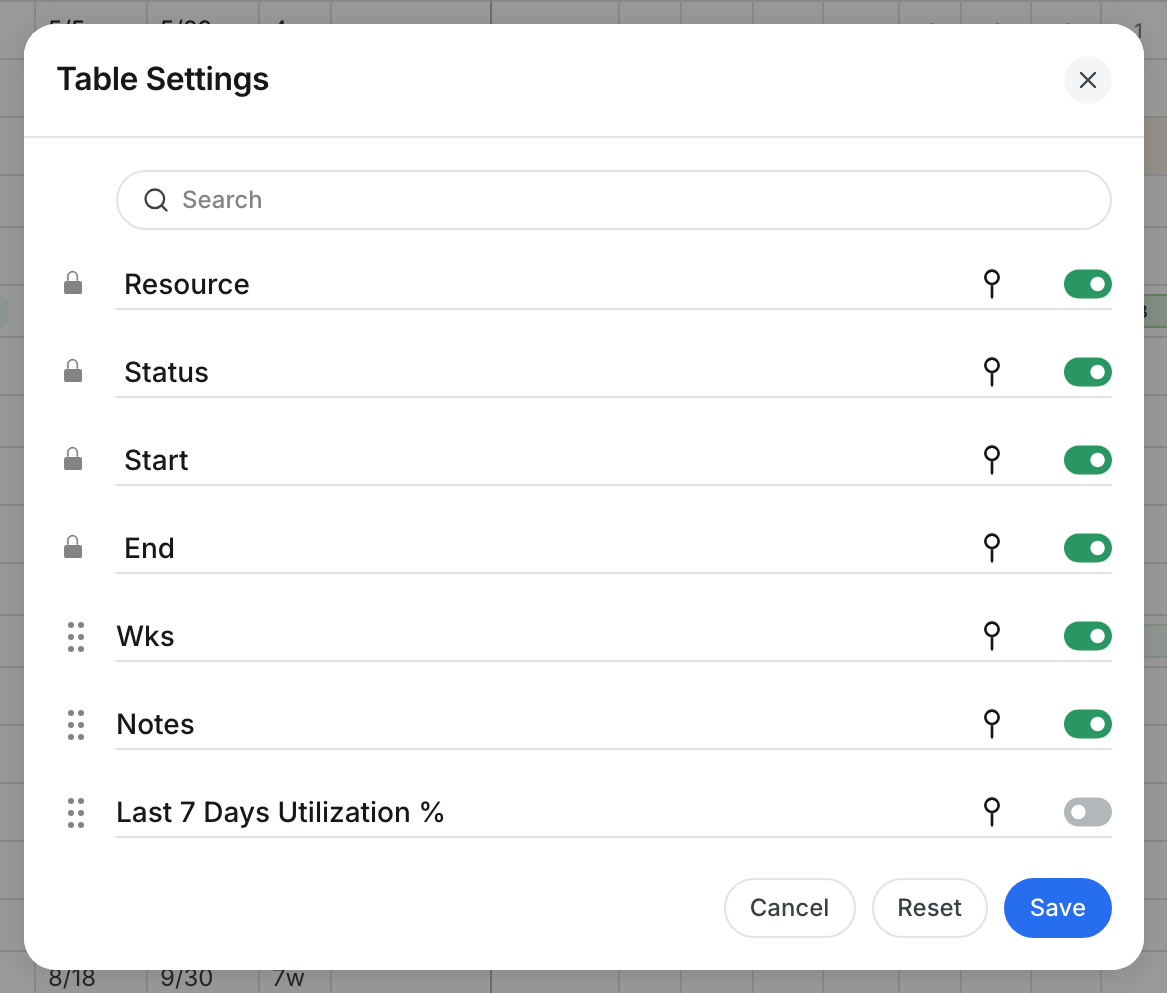
The full details
- Works on: Web app.
- Where: Resource Planner > Planner. The menu item shows when your company uses the Resource Planner.
- Saved in your browser: zoom, status chips, the All/Equipment/People choice, Data Structure, filters, column choices, and which rows are open.
- Dates: The page opens on This Month each time. Scroll right to see more months.
- Loading: Projects load as you scroll down. Projects with no division show under Unassigned.
- Last 7 Days Utilization %: shows for rows with an assigned asset that has a weekly hours target.
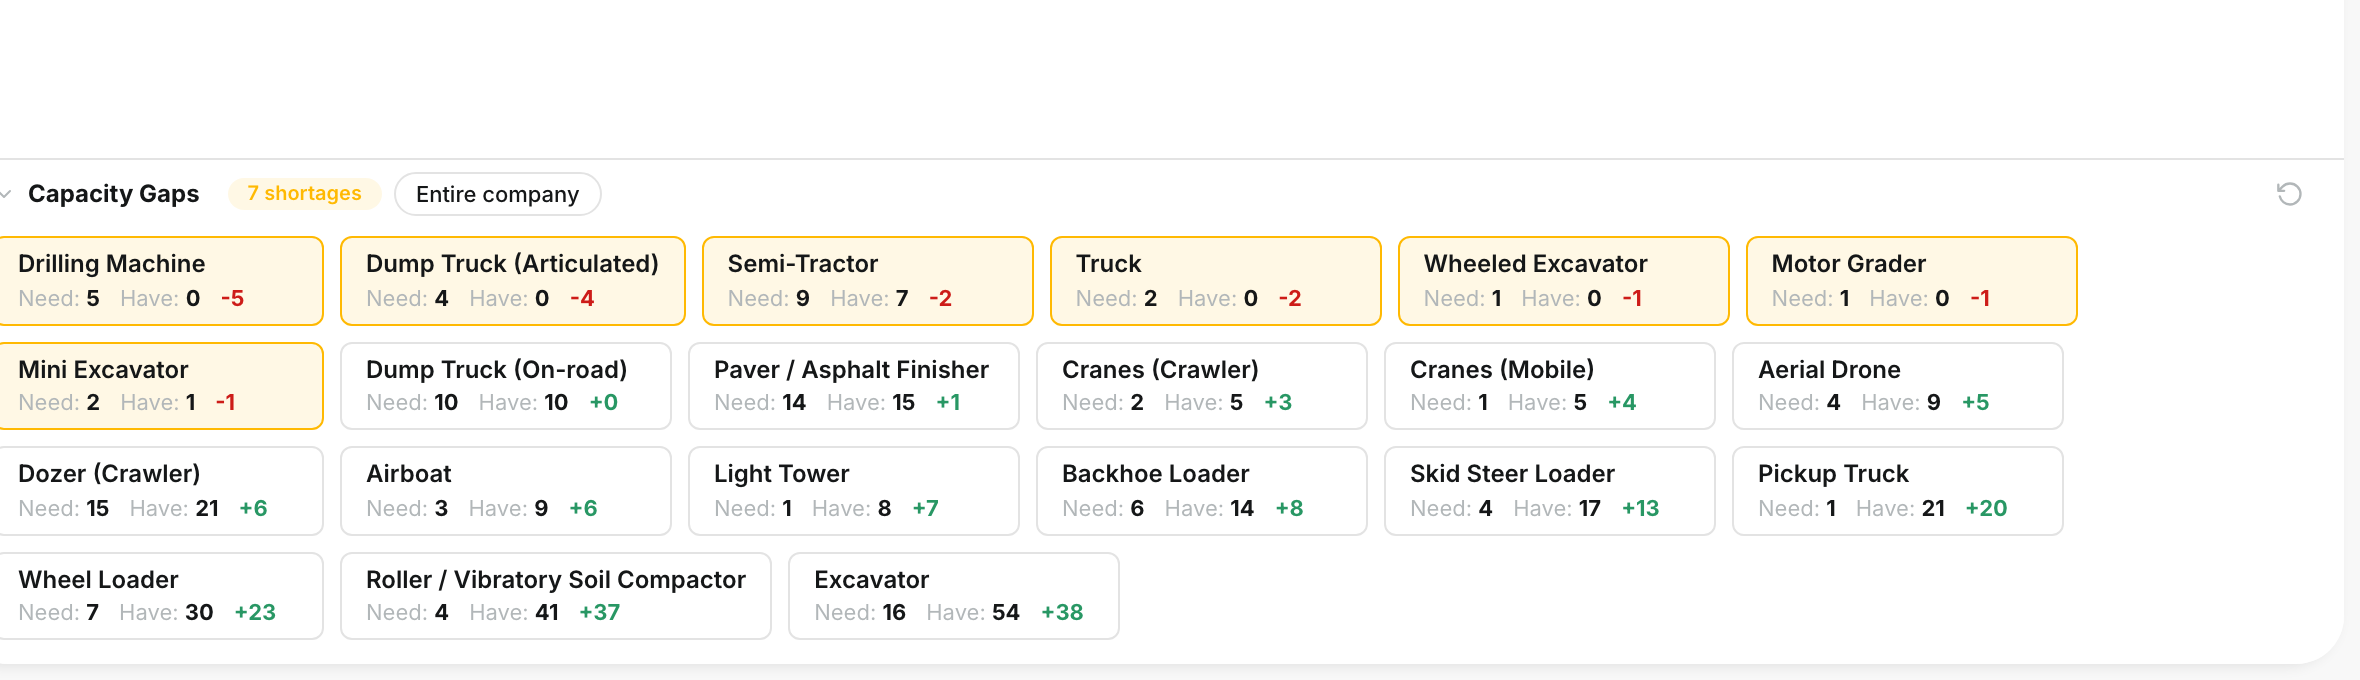
- Capacity Gaps: the panel at the bottom compares demand with your fleet. See "Spot Equipment Shortages with Capacity Gaps".
Tips
- Hover a project or phase and click the open icon to give it its own tab at the top of the page. Right-click a tab to close it or close the others.
- Switch to Equipment when you plan the fleet, and to People when you plan crews. The project totals follow your choice.
- Use Week zoom when you change quantities. Editing cells only works in Week zoom.
- Set up Data Structure once. The Planner remembers it in this browser.