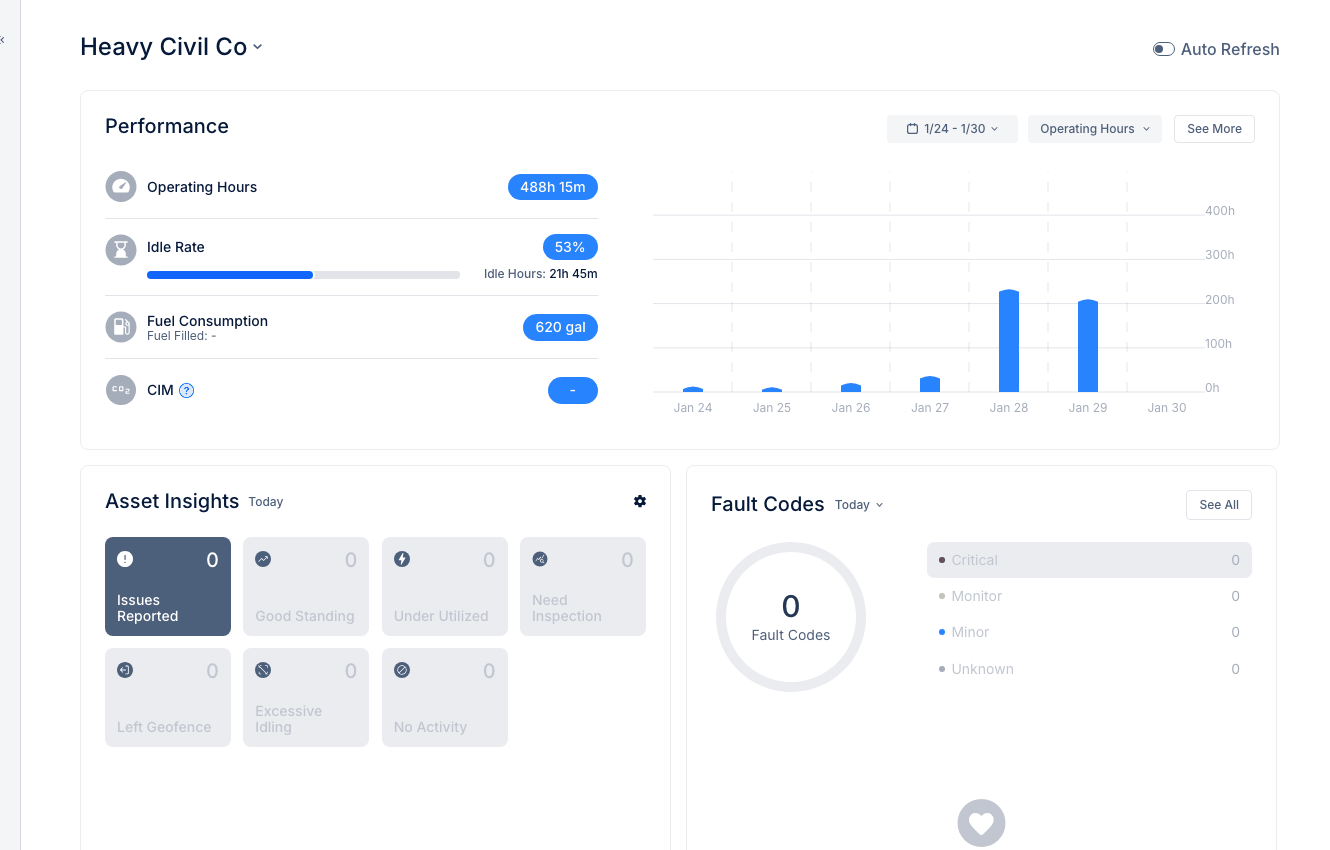
The CLUE Home screen provides at-a-glance insights into your fleet's performance and health through interactive widgets.
Performance Widget
The Performance section shows key operational metrics:
- Operating Hours - Total engine hours across your fleet
- Idle Rate - Percentage of time equipment is idling vs. working
- Fuel Consumption - Total fuel used (gallons)
- CIM (Carbon Impact Metric) - Environmental impact tracking
Use the date range selector to view different time periods.
Asset Insights
Quick status cards showing fleet health:
- Issues Reported - Equipment with inspection issues
- Good Standing - Assets with no current issues
- Under Utilized - Equipment below usage targets
- Need Inspection - Assets requiring inspection
- Left Geofence - Equipment outside boundaries
- Excessive Idling - High idle time alerts
- No Activity - Equipment with no recent activity
Click any card to see the list of affected assets.
Fault Codes Widget
Active fault codes by severity:
- Critical - Immediate attention required
- Monitor - Watch closely
- Minor - Schedule for service
- Unknown - Unclassified codes
Click "See All" to view the full Fault Codes list.
Quick Stats
Fleet summary numbers at a glance showing total assets and active equipment counts.
Tips
- Check the Home screen daily for fleet health overview
- Address Critical fault codes immediately
- Review Under Utilized assets to optimize fleet allocation
- Use Asset Insights to prioritize maintenance activities
