Fleet Financials: Asset-Level Analysis and Sweet Spot | CLUE Learning
Knowing your fleet's total cost is useful. Knowing exactly which assets are driving that cost, and whether they are past the point where keeping them makes financial sense. It's what drives better financial decisions. Fleet Financials: Asset-Level Analysis and Sweet Spot gives you the deepest view available in Fleet Financials, down to a single piece of equipment.
Open any asset and you get its full financial picture: purchase price, engine hours, odometer, lifetime cost per hour, monthly cost breakdowns by category, and a sweet spot analysis showing the point at which repair costs begin to overtake the value of keeping the machine running. This is where replace-or-repair decisions get made with real numbers.
Who Is This For?
- Equipment Managers use asset-level analysis to identify which machines are costing the most to keep running and to build a data-backed case for fleet replacement decisions.
- CFOs and finance teams use the cost per hour lifetime chart and monthly cost breakdowns to evaluate total cost of ownership per asset and assess whether the fleet is generating an acceptable return. This connects directly to CLUE's fleet management solution where financial performance across the fleet is a core concern.
- Operations Leaders use the Replace and Stop Repair toggles to communicate asset status to dispatchers and planners before a replacement arrives.
How to Use It
1. Locate Assets by Product Class Level
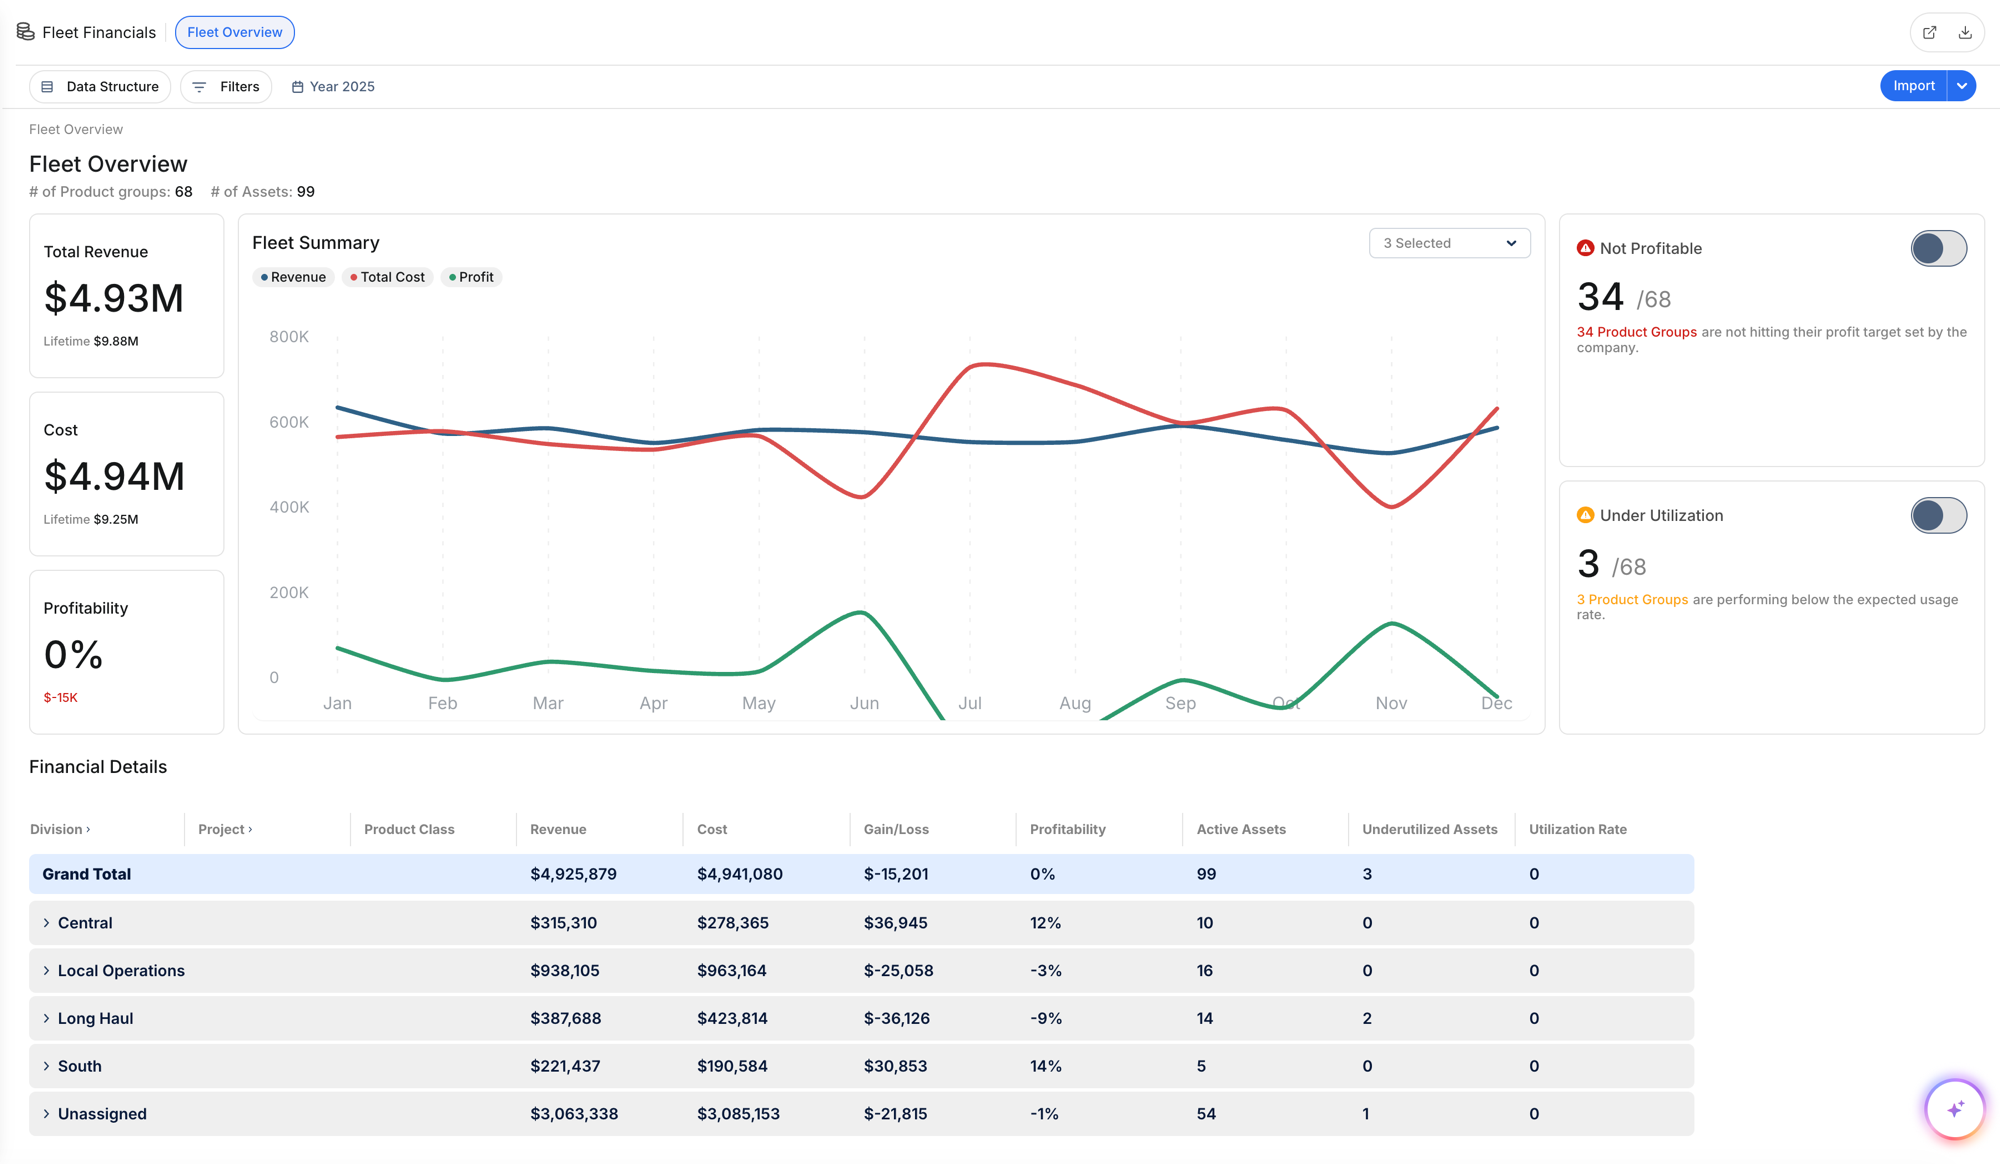
From Fleet Overview, click a division, then a product class. You see all assets in that class with their revenue, total cost, gain/loss, sweet spot metrics, age, hours, and replace/repair status displayed in a single table.
2. Open an Individual Asset
Click any asset to open its full financial snapshot. This shows purchase price, purchase date, age, engine hours, odometer, and salvage value. The Cost per Hour LTD chart displays the cost curve across the asset's lifetime with separate lines for owning (estimated), operating (estimated), and operating (actual).
3. Choose Your Time Range
Click the date selector to switch between Lifetime, Past 12 Months, This Year to Date, or a Custom Year. This changes both the summary cards and the cost breakdown table to reflect the selected period.
4. Mark Replace or Repair
Use the Replace Asset and Repair Asset toggles to flag the asset's current status. When Replace is toggled on, the asset displays as "Replacement planned - asset scheduled to be retired." This signals to dispatchers and planners that a replacement is coming so they can plan assignments accordingly.
5. Edit the Financial Snapshot
Click Edit on the Asset Financial Snapshot to update purchase price, purchase date, engine hours, odometer, and salvage value. You can also set target thresholds for replacement planning purposes.
6. Review the Cost Breakdown
The Financial Details table shows monthly costs by category including OwningCosts, OtherCosts, and OperatingCosts with sub-categories for labor, outside repairs, and revenue. Click the arrow next to any category to expand it and see exactly where costs are going each month.
Key Behaviors and Limitations
- Sweet spot is calculated at two levels. The sweet spot cost shows cost per hour at the optimal replacement point. The sweet spot hours shows the engine hours at that same point. Both appear on the asset view.
- Replace and Stop Repair are independent toggles. You can plan a replacement while still repairing the asset, or stop repairs while waiting for the replacement to arrive. The two decisions do not have to happen at the same time.
- Table columns are customizable. Use Table Settings to choose which columns appear: Revenue, Total Cost, Gain/Loss, Sweet Spot, Age, Hours, Odometer, Replace, Stop Repair, Make, Model, Serial Number, and Ownership.
- Date ranges apply to both the summary and the breakdown. Switching between Lifetime, Past 12 Months, This Year, or Custom Year changes all data displayed on the page, not just the chart.
Tips
- Look at the cost per hour LTD chart for trends. If the operating cost line is climbing steeply while owning costs stay flat, the machine is likely past its sweet spot and the numbers will support a replacement conversation.
- Compare assets within the same product class. Open multiple assets from the same class. A machine with a $20,000 lifetime operating cost sitting next to one with $166,000 tells a clear story about which asset needs attention.
- Set salvage value targets accurately. Salvage value anchors the sweet spot calculation. If the value is not realistic, the analysis will not be accurate. Update it based on current market conditions for that asset type.
- Toggle Replace before committing to a purchase. Flagging an asset for replacement in CLUE signals to the rest of the team that a change is coming, reducing the chance of long-term assignments being made to equipment that is about to be retired.