Fleet Financials: Fleet Overview
What is this?
Fleet Financials is your company's financial command center for equipment. It shows revenue, total cost, profitability, and utilization across your entire fleet. Start at the fleet level, drill into divisions, then product classes, then individual assets. Import your cost data from CSV. Make replace-or-repair decisions with real numbers.
How to use it
Step 1: Open Fleet Overview
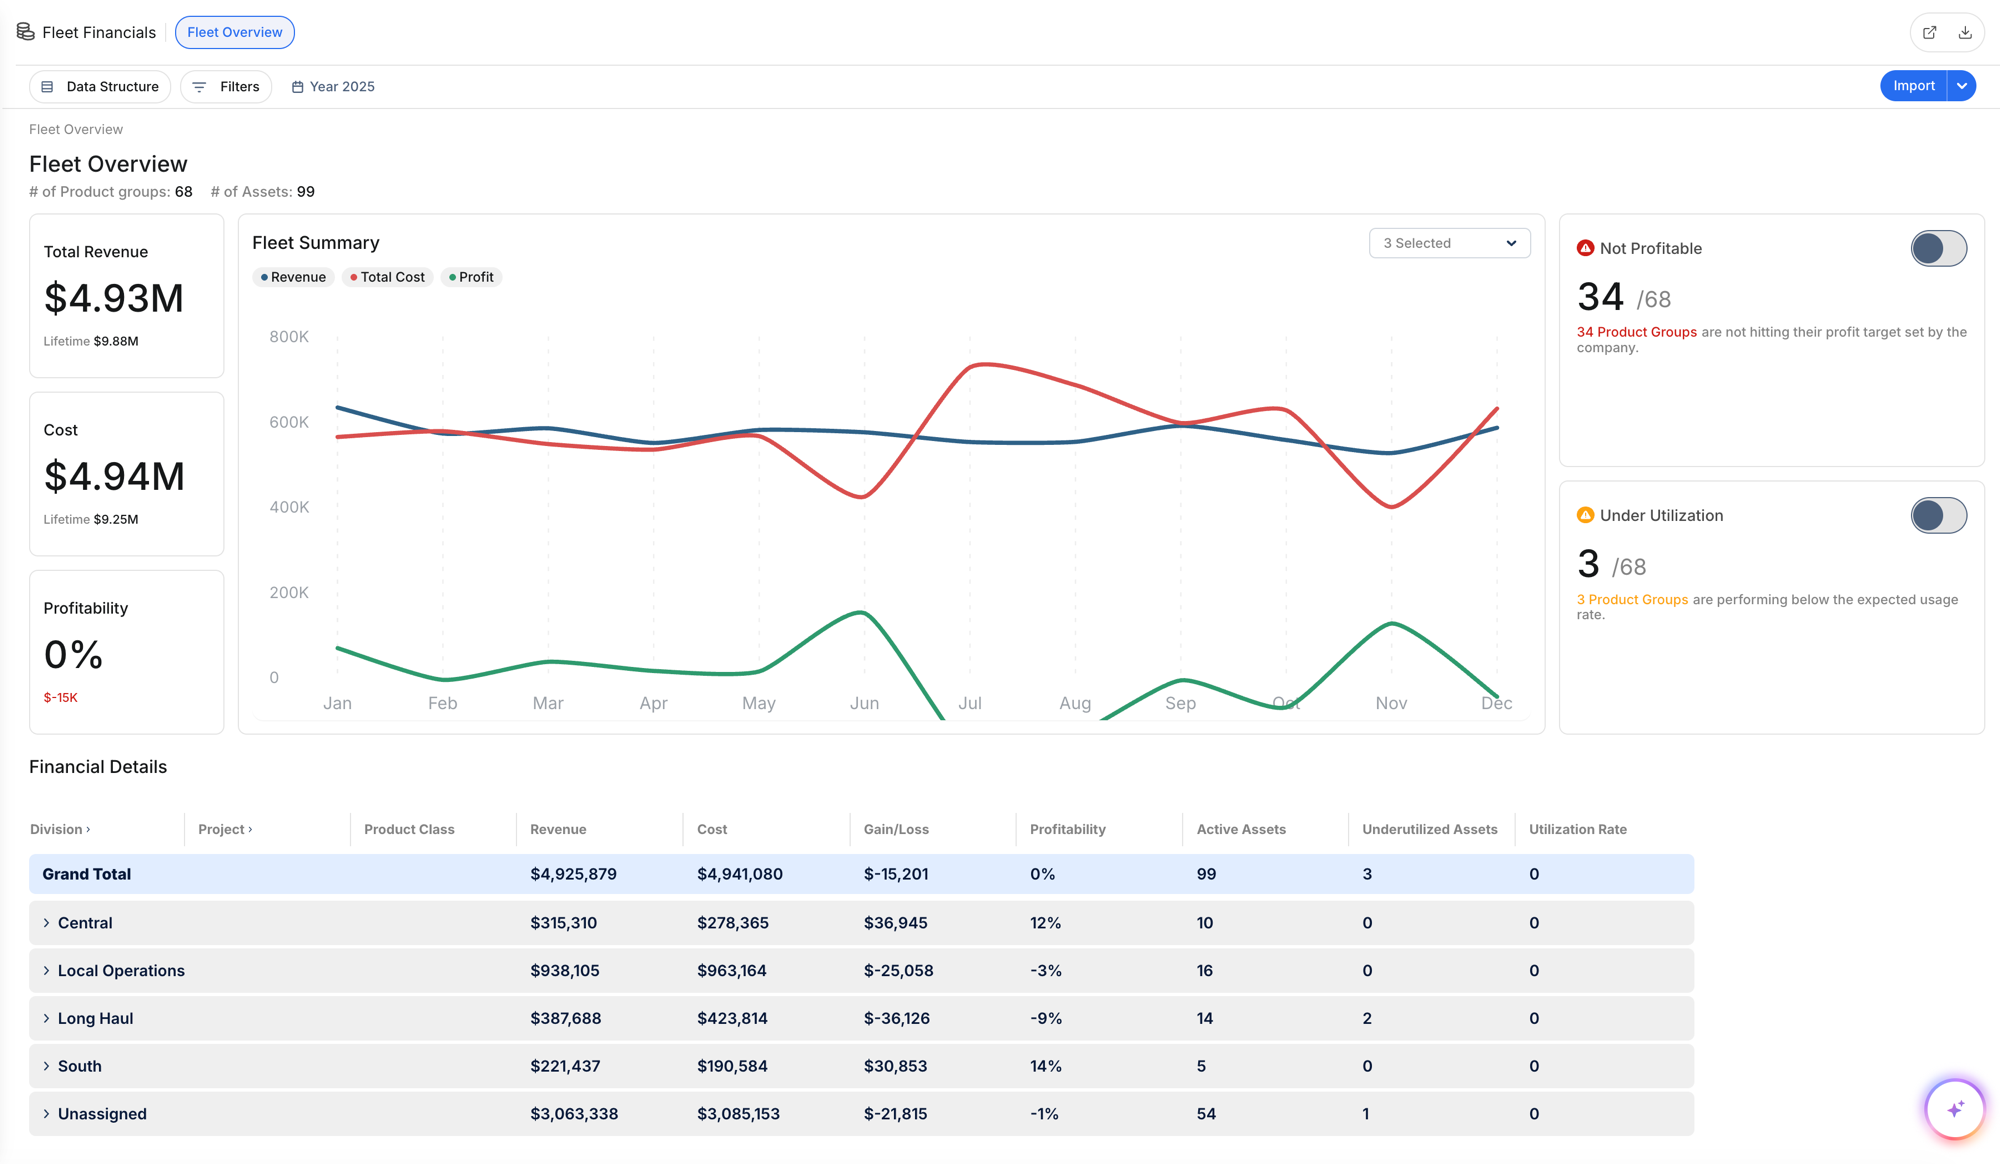
Go to Fleet Financials in the sidebar. The Fleet Overview shows your full fleet with summary cards (Total Revenue, Cost, Profitability), a trend chart, and performance indicators (Not Profitable assets, Under Utilization).
Step 2: Import your data
Click the Import button in the top right to upload financial data from CSV. Download the template first to see the expected format. This is how you bring in revenue, costs, depreciation, and other financial data from your accounting system.
Step 3: Drill into divisions
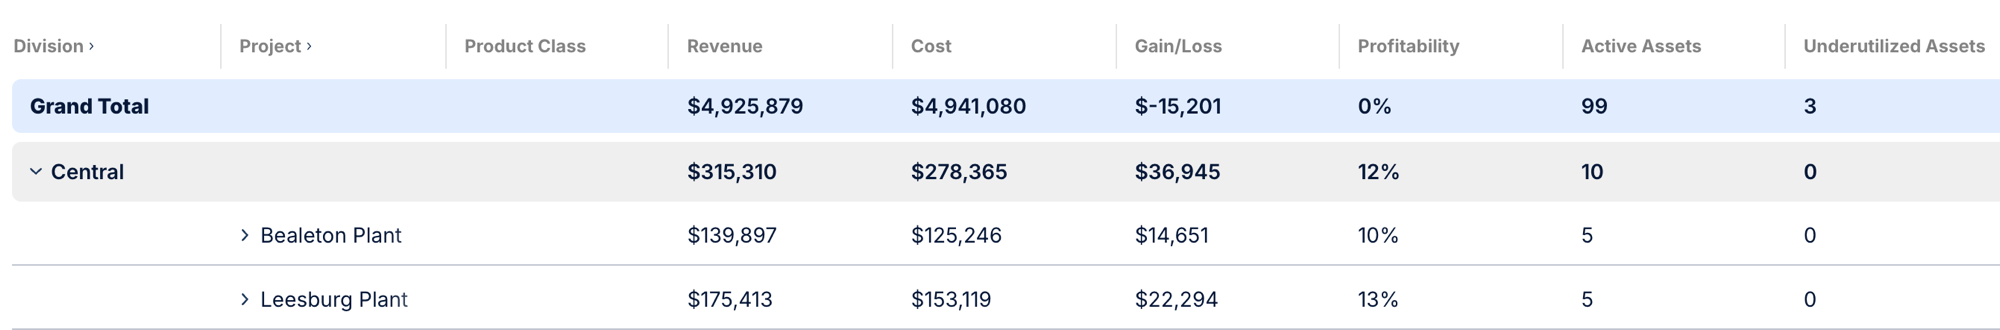
The Financial Details table shows divisions with revenue, cost, gain/loss, profitability, active assets, and underutilized count. Click any row to drill deeper.
Step 4: Choose your data structure
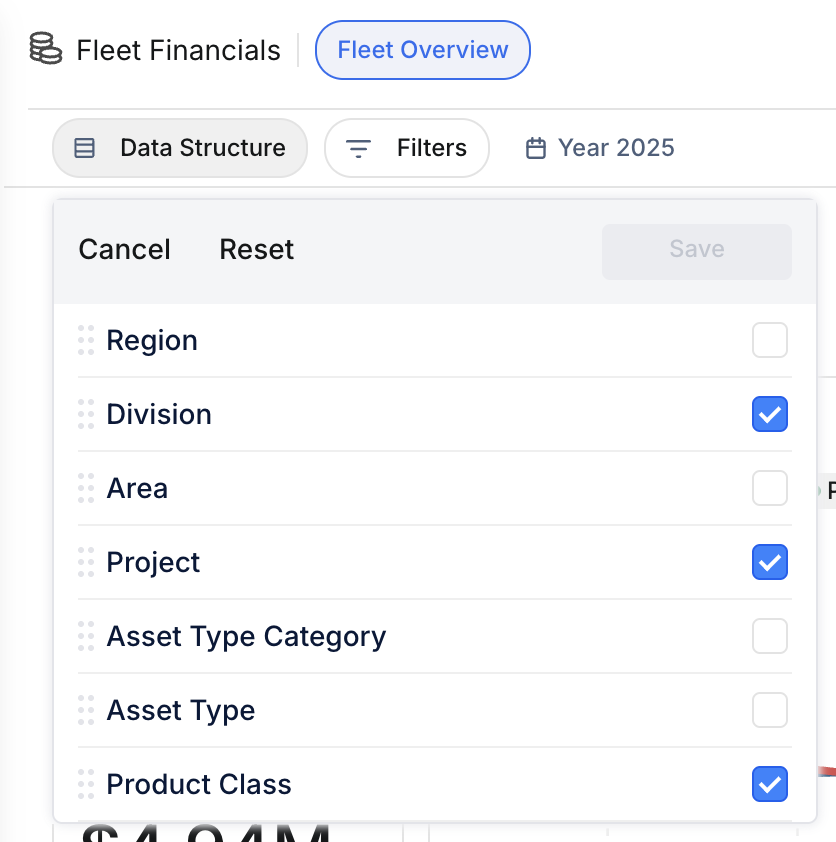
Click Data Structure to change how the table is grouped. Options include Region, Division, Area, Project, Asset Type Category, Asset Type, and Product Class.
Step 5: Customize the chart
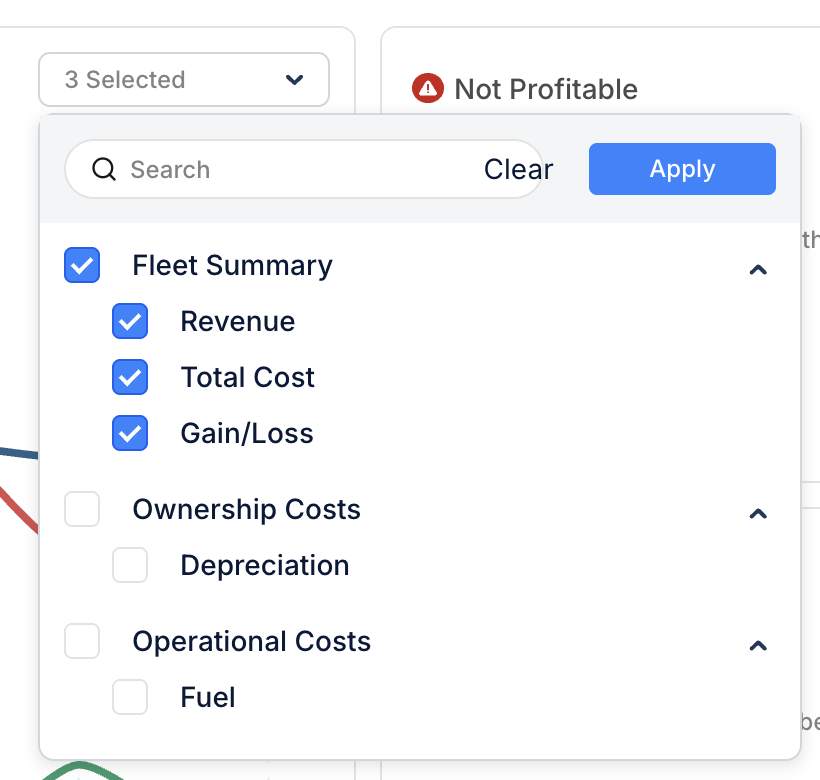
Use the chart selector to choose which metrics appear on the trend chart: Fleet Summary (Revenue, Total Cost, Gain/Loss), Ownership Costs (Depreciation), and Operational Costs (Fuel).
The full details
- Works on: Web app
- Location: Finance > Fleet Financials
- Date ranges: Lifetime, Past 12 months, This Year (To Date), or Custom Year
- Import: CSV upload with downloadable template
- Export: CSV or Excel download. Share by email directly from the app.
- Filters: Organization, project, asset type, crew, ownership type
Tips
- Start with the Not Profitable indicator. If 34 out of 68 product groups are not hitting targets, that is your starting point for investigation.
- Use YTD for current decisions, Lifetime for long-term trends. A machine losing money this year might be profitable over its lifetime. Or the opposite.
- Import data monthly. The more current your financial data, the better your decisions.
