Asset Reliability Report
What is this?
A new report that shows how reliable your equipment is. It calculates Mean Time Between Failures (MTBF) for each asset class and shows which fault codes come up the most. Instead of guessing which machine types give you the most trouble, now you have the numbers.
Who is this for?
- Equipment Managers - Identify which asset classes break down the most and decide what to replace vs. repair.
- Shop Managers - See which fault codes keep coming back so you can stock the right parts.
- Operations Managers - Export the data and combine it with cost reports to find your "lemons."
How to use it
Step 1: Open the report
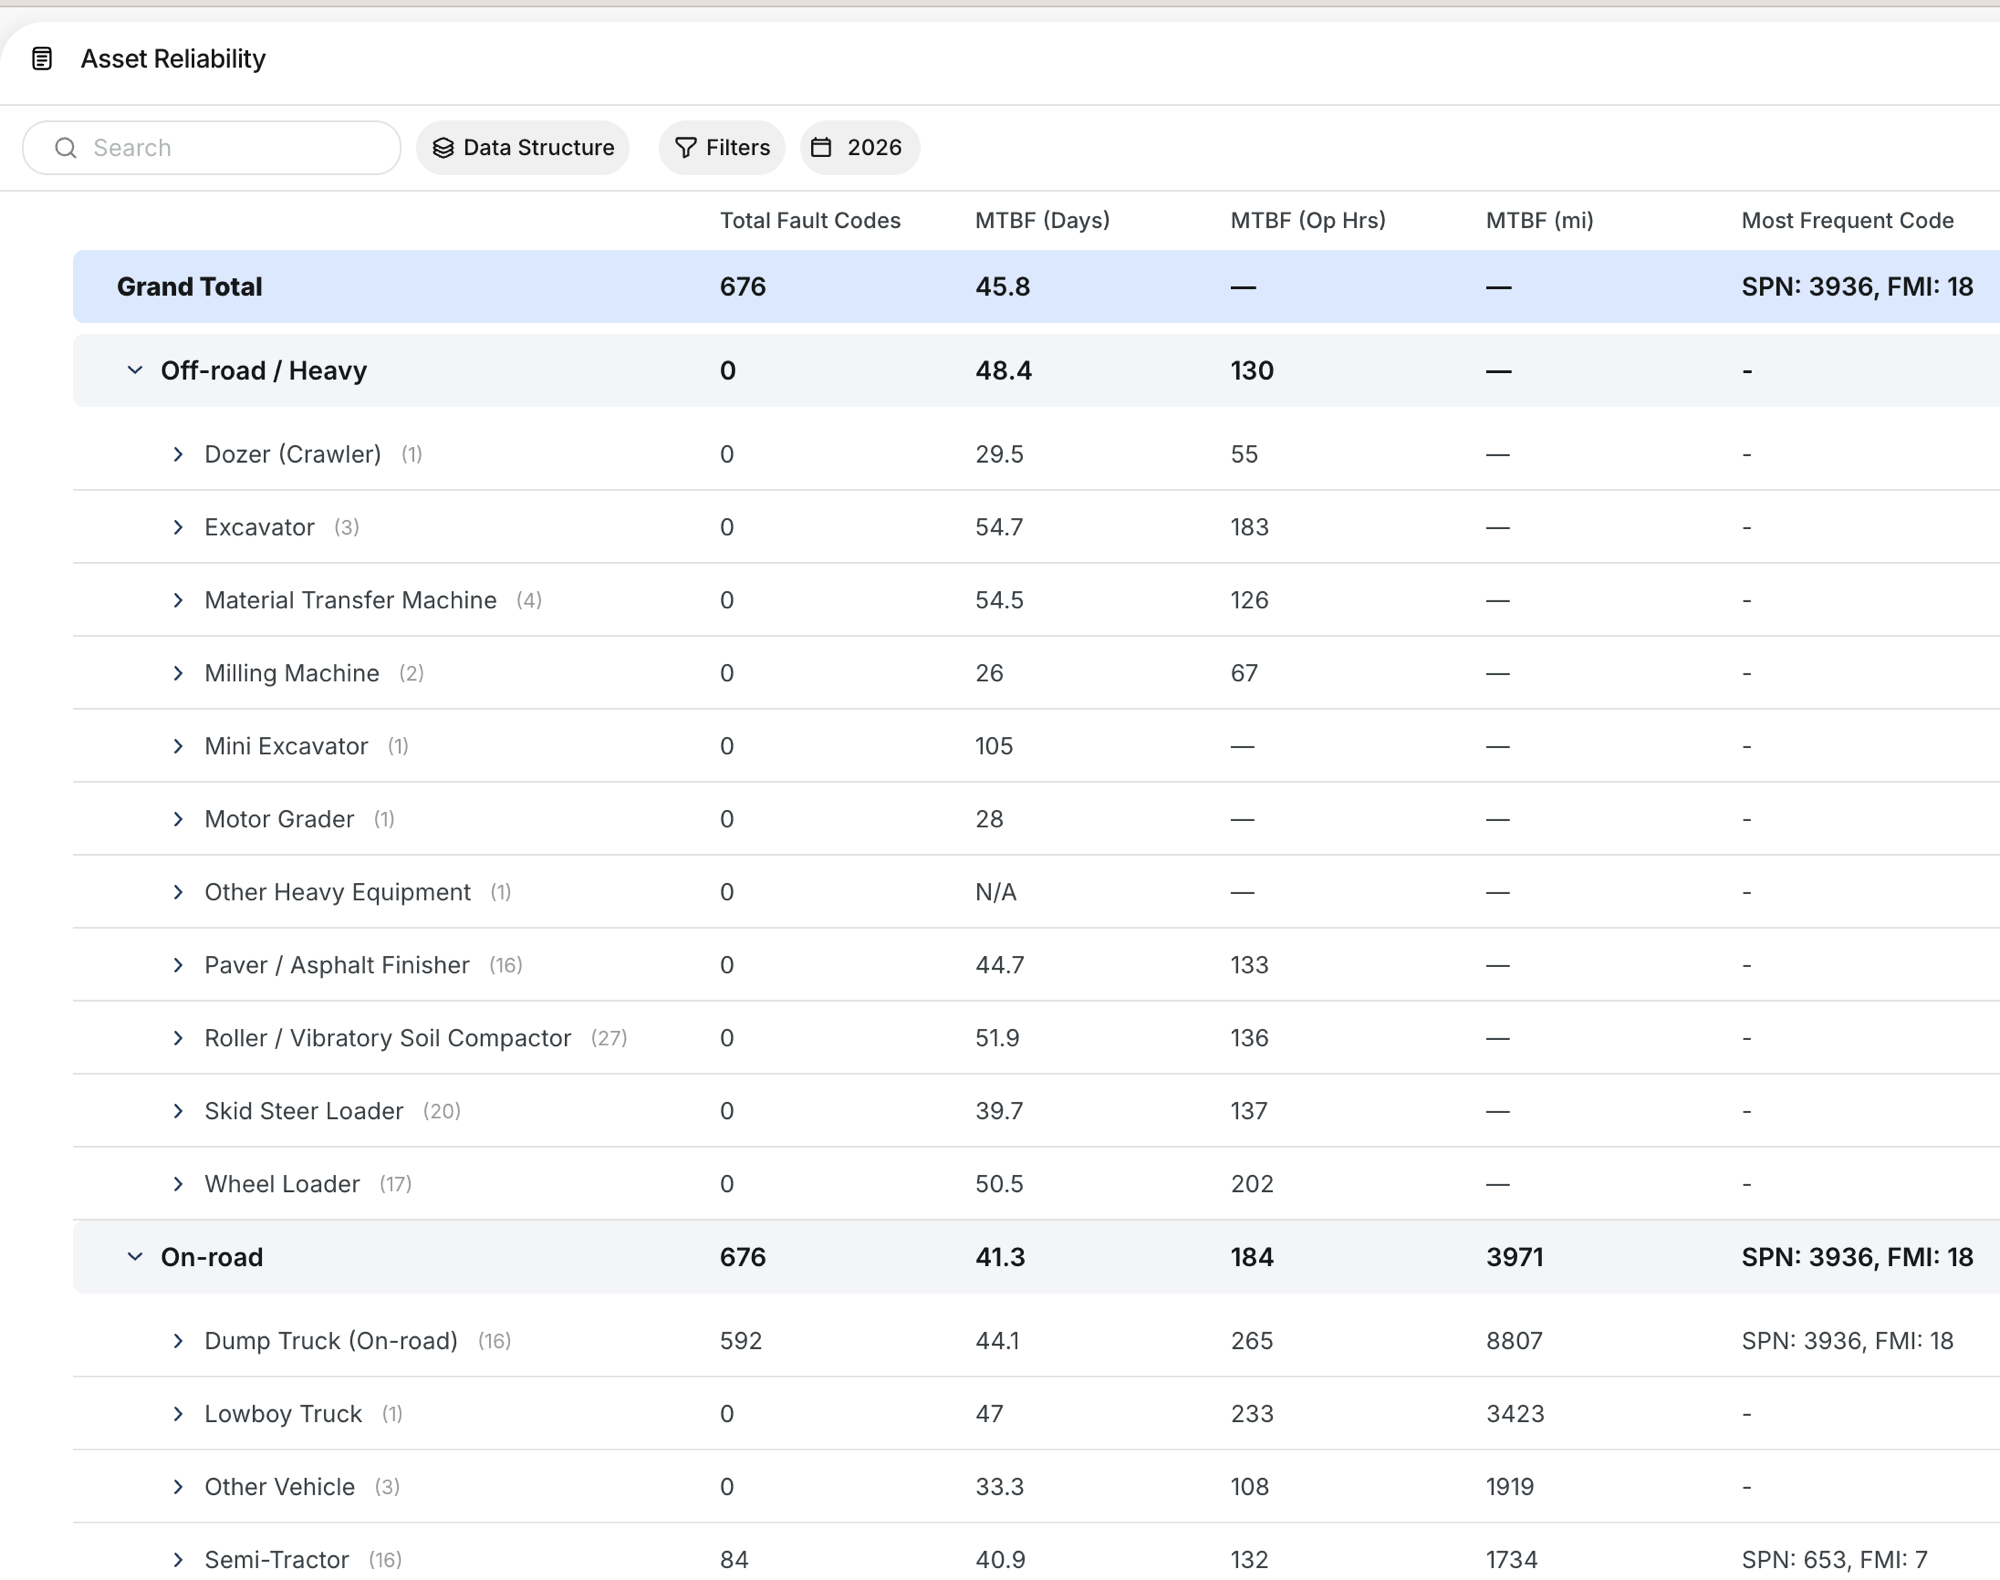
Go to Reports in the sidebar and select Asset Reliability. The report shows your full fleet grouped by asset category (Off-road/Heavy, On-road, etc.) with MTBF and fault code totals.
Step 2: Customize the data structure
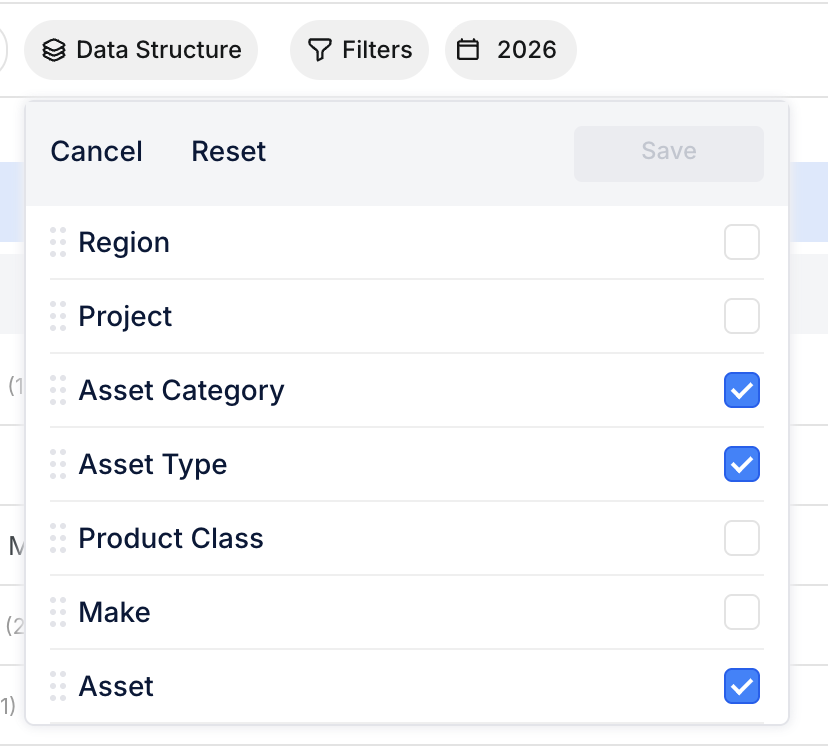
Click Data Structure to choose how the report is grouped. You can break it down by Region, Project, Asset Category, Asset Type, Product Class, Make, or individual Asset. Check the levels you want, then click Save.
Step 3: Drill into a category
Click the arrow next to any asset class to expand it and see individual assets. Each row shows total fault codes, MTBF in days, operating hours, and miles, plus the most frequent fault code for that group.
The full details
- Works on: Web app
- MTBF calculation: Average days between fault code events across all assets in a class
- Date range: Selectable by year (default: current year)
- Filters: Filter by date range plus standard filters
- Export: Full data exportable for external analysis
- Grouping levels: Region, Project, Asset Category, Asset Type, Product Class, Make, Asset
Tips
- Sort by MTBF ascending to find your least reliable asset classes first.
- Check the Most Frequent Code column to spot recurring issues. If one fault code dominates a class, it might point to a systematic problem.
- Export and combine with cost data to build a full replace-vs-repair picture. MTBF alone does not tell the whole story without repair costs.
